Global Journal of Food Science and Technology received 193 citations as per Google Scholar report


Received: 25-May-2022, Manuscript No. GJFST-22-55737; Editor assigned: 27-May-2022, Pre QC No. GJFST-22-55737 (PQ); Reviewed: 10-Jun-2022, QC No. GJFST-22-55737; Revised: 17-Jun-2022, Manuscript No. GJFST-22-55737 (R); Published: 27-Jun-2022, DOI: 10.15651/2408-5456.22.10.049
Low available soil nutrient status and reduced plant-use-efficiency are some of the major constraints limiting bread wheat yield in growing areas of Ethiopia. Ensuring a well-balanced supply of N to the bread wheat crop may result in higher grain yield. The national recommendation of nitrogen fertilizer rate is 46 kg N ha-1 and this rate is recommended to most of the farmer to apply in two splits, i.e., is 30% at sowing and 70% at tillering stage but in the study area there is little knowledge among farmers. Therefore a field experiment was conducted during 2018 main cropping season in western mid-latitude of Ethiopia to evaluate the effects of rates and timing of nitrogen on yield and yield components as well as nutrient use-efficiency of bread wheat, which was grown on Nitisol of Benshangul Gumuz region. The treatments studied consists of three N rates (46, 69, and 92 kg ha-1) laid out in Randomized Complete Block Design with four replications. The results revealed that marked improvement on NUE, growth, phenology, yield and yield components of bread wheat due to different levels. The application of nitrogen at higher rates of 69 kg ha-1 significantly increased most of the measured parameters compared with the control plots. The highest grain yield (4.93 t ha-1) was recorded from the application of 69 kg N ha-1, the partial budget analysis revealed that, the highest net return of (53,486.9 ETB ha-1) from the application of 69 kg N ha-1. Therefore, based on the results of the current experiment, the use of 69 kg N ha-1 can be suggested for improved productivity of wheat for the study area, although over season and location experiment is demanding to confirm the current findings.
Grain yield, Nitrogen rates, Nitrogen use-efficiency, Bread wheat
Background and Justification
Bread wheat (Triticum aestivum L.) is one of the most important food cereals which belongs to the family Poaceae and tribe Triticeae (Ahn et al., 1993). It is one of the first domesticated food crops and basic staple food for countries like Europe, West Asia and North Africa. Currently, bread wheat is produced on more land area than any other commercial crop and continues to be the most important food grain source for humans (Dixon et al., 2009). In Ethiopia it is cultivated on about 1.7 million hectares of land with grain production of 3.5 million tons which make the country the second largest producer in Africa (CSA, 2018).
Now a days, bread wheat consumption has been steadily increasing throughout Africa as a result of population pressure, changing food preferences and a strong urbanization trend which has led to a growing ‘food gap’ in all regions which largely met by imports (Macauley, 2015). Also, the yield gap between on-farm and potential yield remains very high, often greater than fivefold (FAO, 2013). Compared to global average bread wheat productivity (3.3 t ha-1), its yield in Sub-Saharan Africa (SSA) is 1.68 t ha-1 (FAO, 2013). But some of the world’s highest spring bread wheat yields are obtained in Egypt averages about 7 t ha-1. Ethiopian farmers have obtained more than 8 t ha-1, new varieties introduced through SARD-SC in Nigeria yield up to 7 t ha-1.
The productivity of bread wheat in Ethiopia is low compared to other bread wheat producing countries of the world. Reasons for this includes the use of traditional production systems; the influence of biotic (e.g. diseases particularly rust) and abiotic factors; and the lack of production inputs and/or sub-optimal use of recommended packages (Macauley, 2015).
Application of N fertilizer usually has significant effects on cereal grain yield and quality (Tran et al., 2000). The wheat yield response to N fertilizer varies with the climatic conditions and soil N supplying power during the growing season (Lauer et al., 2011; Tran et al., 2000) and with cultivar (Weaver et al., 2005; Woyema, 2012). A significant increase in grain yield has been observed with N fertilization especially when soil N supply was low, but application of very high N rate can reduce grain yield by increasing lodging and disease incidence (Otteson, 2007).
Bread wheat is one of a priority cereal crop for achieving food security in BGRS and is cultivated on more than 2033 hectares of land and has a total grain production of about 4289.63 tons per annum (CSA, 2016). However, it has given low yield due to many production constraints such as minimum use of improved varieties, diseases, weeds, and low soil fertility and lack of location specific fertilizer recommendation in Ethiopia in general and Western Ethiopia in Benshangul Gumuz Regional State (BGRS) in particular.
Farmers in this area apply N fertilizer in the form of urea at sub-optimal blanket rates and use low amounts of nitrogen in the form of urea for bread wheat production. The amount of nitrogen applied to plants must be carefully managed to ensure that N will be available throughout the growing season and the vegetative and reproductive development will be not restricted.
Statement of the Problem
The productivity of bread wheat in Ethiopia is low compared to other countries of the world. Poor crop yields, caused largely due to the use of traditional production systems, the influence of biotic (diseases caused by rust) and abiotic factors, lack of production inputs unavailability of improved varieties and poor crop management practices are among the most important factors underlying low productivity of crops and food insecurity in Africa (Macauley, 2015).
Among the mineral elements, low availability of nitrogen (N) most often limits growth and yield of cereals, which require relatively large amount of N (from 1.5% to 5% of the plant dry weight) compared to legumes (Baligar et al., 2014; Chatzistathis et al., 2013; Sen et al., 2015). It is required in large quantity because it is involved in formation of compounds such as proteins, nucleic acids, chlorophyll, and growth regulators, all of which have crucial roles in plant growth and development (Barraclough et al., 2014). As a results when supplied in optimum amount it increases leaf size, growth rate, final yield and protein content (Samuoliene et al., 2007). Plants deficient in N have pale green or yellow leaves because of the lack of chlorophyll and become stunted through lack of leaf expansion (Thakur, 2003).
Addition of N from fertilizer is typically needed to maximize crop yields; this requirement has resulted in the development of a large N fertilizer industry (Walsh et al., 2018; Zebarth et al., 2007; Barraclough et al., 2014; Daniel et al., 2017). Some estimates suggest that N fertilizer accounts for 80% of all fertilization costs and 30% of all energy costs associated with crop production (Gaju et al., 2011). Although it is well accepted that sufficient N is needed to obtain high yields, growers each year must determine how much fertilizer N to supply for crop. This problem results from the complex cycle of N in the environment, which can allow loss from the root zone (Hirel et al., 2011). It is further complicated by mechanistic inconveniences associated with fertilizer N application and by uncertainty related to weather conditions, especially water availability (Mann et al., 2017).
Significance of the Study
Information generated from this study intends to present opportunities to farmers to be economically efficient and ensure improved agronomic management practices on N fertilizer application. The study mainly focuses on the best ways to boost yield of bread wheat through applying appropriate agronomic practices and understanding underlying scientific processes in nutrient uptake of the crop in relation to measured growth and yields. Hence, the increased yields due to optimum rates N fertilization will motivate farmers to devote their lands for bread wheat farming in order to get better yields than the traditional farming practices. Therefore, through this efforts food security will be assured among the poor farmers and boost the nutritional benefit of millions of people who live majorly on starchy staples. The study would believe to serve as general guide line for farmer or development agency that provides an excellent starting point for further investigation.
Description of the Experimental Sites
The study was conducted from August-December, 2018 under rain fed conditions in Benshangul Gumuz Regional State, Western Ethiopia. It is located west of Addis Ababa at about 687 and 125 km from South East of Assosa town in Maokomo special district. Geographically it is located in 9°23´12.93´´ N latitude and 34°24´27.81´´E longitude at an altitude of 1820 m above sea level. The area experiences a mono-modal rainfall pattern and has annual total rainfall of about 1316 mm. The rainy season occurs from March to December and the maximum rain is received in the months of July and August (Figure 1).

Figure 1. Map of the study area.
The minimum and maximum temperatures are 17.0°C and 32.0°C, respectively. The hottest period for BGRS is from February to April. The soil type of the area is mainly Eutric Nitisols and is dark reddish in color (Alemu, 2016). The region is agro-ecologically divided as arid, semi-arid and humid which is 75%, 24% and 1%, respectively in size (BGRFSS, 2004). It is conducive for growing different types of food and cash crops. Sorghum, millet, and maize are the most dominant flood crops grown in the region followed by bread wheat, rice and teff. Oilseeds like sesame, niger seed and sunflower are grown widely (Figure 2).

Figure 2. Monthly rainfall, maximum, and minimum temperature and relative humidity at the study area, 2018. Note: ( ) Monthly received(mm); (
 ) Relative humadity(%); (
 ) Max.Temperature(°C); (
 ) Min.Temperature(°C).
Experimental Materials
The bread wheat variety used in this experiment was “Shorima” which was released by Kulumsa Agricultural Research Center in the year 2011. The variety can adapt an altitude range between 1900-2600 masl (midland type) and requires a rainfall of 600 mm to 900 mm. Have maturity date from 105-150 days, its productivity under research field ranged from 4.4-6.3 tons ha-1 (Beyenesh et al., 2014). Urea (46% N) and Triple Super Phosphate (TSP) with 46% P2O5 were used as source of nitrogen and phosphorus respectively.
Experimental Design and Treatments
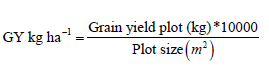
The experiments were laid out in a Randomized Complete Block Design (RCBD) of a 3 × 4 with three N rates (46, 69, and 92 kg N ha-1) and 0 kg N ha-1 as a control for N rates. The space between block, plot and row were 1.5, 0.5 and 0.25 m, respectively. The gross and net harvestable plot areas were 3 m × 3 m (9 m2) and 1 m × 1 m (1 m2), respectively.
Field Management Practices
Land preparation was done prior to the onset of cropping season. Land was cleared of previous crop residues and tractor-drawn disc plough was used during the first and to obtain a fine tilth. The experimental field was measured and demarcated into experimental units measuring 3 meters long by 3 meters wide.
Planting was done manually on 28 August 2018 cropping season. Thirteen treatments were randomly assigned to the experimental units within four replications. Triple Superphosphate (TSP) uniformly applied at the rate of 41.4 g plot-1 (3.45 g) row-1 in uniform dose to all the treatments along the furrows and thoroughly mixed with the soil plots. Nitrogen in the form of urea was applied in different rate and time as treatment sets. Seeds supplied by Kulumsa Agricultural Research Center (KARC) were drilled in the furrows evenly and covered with loose soil. The experimental field was kept weed free by hand weeding and earthing up to ensure strong establishment of the crop in the soil. Out of twelve total rows per plot, two central rows were selected and the area 1 m2, then bread wheat plant were harvested and placed in small bag, tied and threshed by placing on clean canvas mat for biological yield, grain yield and Thousand Kernels Weight (TKW) determination. TKW were determined by counting the number of grains per plant using seed counter machine and weighing by sensitive balance for each experimental units, biological yield and grain yield were measured and converted to ton ha-1. Before harvesting of bread wheat plant, randomly ten bread wheat plants were selected to measure above ground plant heights, number of seeds per spike and spike length (cm) and average were taken for the statistical analyses. To determine tillering per 1 m2, 10 cm × 25 cm demarcated after germination was first counted and recounted at maturity. Finally the difference between the first and second count converted into 1 m2.
Soil Sampling and Analysis
At the start of the experiment after demarcation of the experimental units, soil sub-samples were collected using a soil auger in a zigzag pattern from 12 spots at a depth of (0-20 cm). The sub-samples were mixed to obtain a composite sample which were air-dried in a well-ventilated room for 3 days then grounded and passed through a 2-mm sieve. They were packed in plastic bags, labeled and analyzed at Debireziet Agricultural Research Center (DZARC). The samples were used to assess the initial soil fertility status for the experiment.
The pH of the soil was determined according to FAO (2008) using 1:2.5 (weight/volume) soil sample to CaCl2 solution (0.01 M) ratio using a glass electrode attached to a digital pH meter. About 10 g of air-dry soil samples were added to 25 ml of distilled water and the mixture shaken at 260 reciprocations per minute for 10 minutes and allowed to settle for 30 minutes. The pH of the soil suspension was recorded thereafter, using a pH meter (Model SG78) on a glass electrode. Nitrogen was obtained by modified Kjeldahl method (Ryan et al., 2012). Organic carbon content was determined using modified Walkley and Black wet oxidation procedure described by Ryan et al. The available P was determined by the Olsen P method as described by Olsen and Sommers.
Plant Sampling for N Analysis
Plant samples collected at physiological maturity were partitioned into grain and straw (stems, leaves and chaff) to determine N contents in the grain and straw. The plant samples were washed with distilled water and oven dried at 70°C for over 24 hours to a constant dry weight measured using an electronic balance FAO (2008). The straw and grain samples were ground with rotary mill and allowed to pass through a 2 mm sieve for straw and a 0.5 mm sieve for grain. The N content of the grain and straw samples were determined using the wet digestion method, which involved the decomposition of the plant tissues using various combinations of HNO3, H2SO4 and HClO4 by using Kjeldahl procedure described by the American Association of Cereal Chemists (FAO, 2008).
Data Collection
Phenological parameters:
Days to emergency: It was recorded by counting the days taken from date of sowing to the date when emergence was completed in a plot. The observation was recorded visually by counting seedling emerged when no more number increased in a sampled row.
Days to 50% heading: It was taken as number of days from sowing up to the date when the tips of the panicles first emerged from the main shoot, on 50% of the plant in a plot.
Days to 90% physiological maturity: It was recorded as number of days from the date of sowing up to the date when 90% of the crop stands in a plot changed to light yellow color.
Growth parameters:
Plant height and spike length: These parameters were measured when the crop reached maturity by measuring from 10 randomly selected plants from the net plot area.
Leaf area index: Five plants per net plot were randomly taken to measure leaf area per plant (cm2) at 50% heading using the method described by Sticker et al. (1961) as:
Leaf area=length of the leaves × maximum width of leaf × 0.875 where=0.875 is the correction factor of leave area for small cereals (wheat).
Then the leaf area index was calculated as the ratio of unit leaf area plant-1 to the ground area covered by the plant (FAO, 2008).
Number of tillers: To determine the capacity of tillering per 1 m2, 10 cm × 25 cm area was demarcated; and the number of plants existed in that area counted before tillering. Then recounting was done after at maturity on demarked area; because maximum tillers produced during vegetative phase and senescence occurs at maturity (Fairey et al., 2001). Finally the difference between the first and second count were converted into 1 m2.
Yield and yield component parameters:
Number of kernels per spike: It was taken from ten randomly selected spikes per net plot at harvest and was averaged to per plant basis.
Thousand kernels weight: It was determined by weighing 1000 kernels sampled from the net plot using a sensitive balance and the seed was adjusted to 12.5% moisture content.
Biological yield: Both the straw and grain recorded from nine center rows after oven dried to a constant weight.
Grain yields: It was recorded from nine center rows and then adjusted to 12.5% moisture level. The grain yield was taken by harvesting and threshing the grain yield from net plot area and converted to t ha-1.
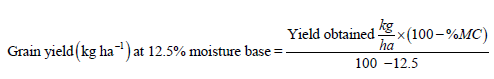
Where, MC=grain moisture content. Grain yield ha-1 was calculated in kilograms as per the following formula:
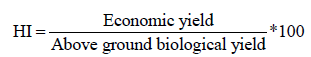
Harvest index: it was calculated as the ratio of grain yield to the above ground dry biomass yield expressed as a percentage
Diseases insects and abiotic damage
Lodging index: It was recorded using the method of Caldicott et al. (1979). The angle of leaning was scored on a 0-5 scale where “0” stands for completely upright plants and “5” stands for completely lodged (flat on the ground) plants. The severity for each score was recorded as the percentage of the entire plot. Then, the lodging index was obtained as the average of the product sum of each degree of lodging and the corresponding severity percent
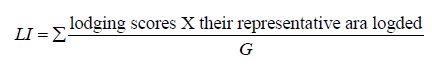
G=ground cover in m-2
Nitrogen Use Efficiency
Nutrient recovery and uptake, agronomic and physiological nutrient use efficiency was calculated from established formulas and facts as follows:
Nitrogen Uptake Traits Grain nitrogen (kg ha-1) uptake was computed as grain yield multiplied by percent N content of the grain for each plot.
Straw nitrogen (kg ha-1) uptake was calculated as straw yield multiplied by percent N content of the straw in each plot.
Total nitrogen (kg ha-1) uptake was obtained as the sum of grain nitrogen uptake and straw nitrogen uptake.
The efficiency of N applied in the different treatments was estimated by calculating the N recovered in the above ground biomass of bread wheat (straw and grain) from the N applied in the treatments using the formula described by Apparent N recovery (%)
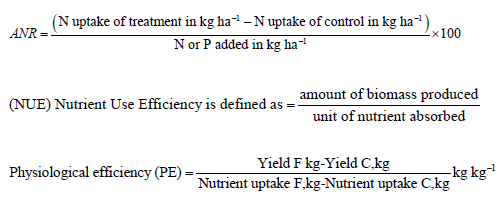
Where F is plants receiving fertilizer and C is plants receiving no fertilizer.
Agronomic Efficiency (AE) is expressed as the additional amount of economic yield per unit nutrient applied.
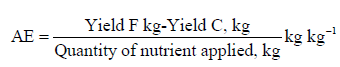
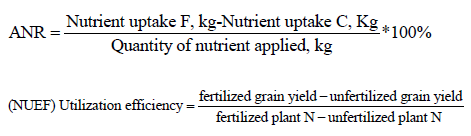
Agro Physiological Efficiency (APE) has been defined as the economic yield (ex. grain) obtained per unit of nutrient absorbed:
Apparent Nutrient Recovery efficiency (ANR) has been used to reflect plant ability to acquire applied nutrient from soil:
Relation between Parameters
Correlation: Finally association between yield and yield components was computed using simple correlation coefficients. When two variables (tillers and grain yield of wheat) are associated and the variation in one is associated with the variation in the other, this association is called correlation. When the increase or decrease in one variable is related with increase or decrease in the other variable, it is called as ‘positive correlation’. When increase in one variable is associated with decrease in another variable or vice versa, it is called as ‘negative correlation’. The degree of association is measured by ‘correlation coefficient’ which is denoted by ‘r’. It is calculated as under:
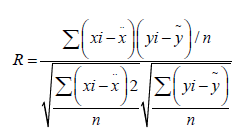
X=number of tillers
áº=mean of number of tillers
Y=expected yield
YZ=mean yield of the observed data
After knowing the association between two variables ‘r’ was tested for significance as under:
t=‘t’ value of ‘t’ distribution for n-2 df. (Degree of freedom)
R=correlation coefficient
n=number of paired observations
If calculated “t” is greater than tabulated “t”, the “t” is statistically significant which means there is a close association.
Economic Analysis
The economic analysis was carried out by using the methodology described in (CIMMYT, 1988) in which prevailing market prices for inputs at planting and for outputs at harvesting were used. All costs and benefits were calculated on hectare basis in Birr. The concepts used in the partial budget analysis were the mean grain yield and straw yield of each treatment, the Gross Benefit (GB) ha-1 (the mean yield for each treatment) and the field price of fertilizers (Urea and the time of application costs). The benefit of biomass yield was included in the calculation of the benefit since the farmers in the area use it. Marginal rate of return, which refers to net income obtained by incurring a unit cost of fertilizer and its application, was calculated by dividing the net increase in yield of bread wheat due to the application of each fertilizers rate.
Unadjusted Grain Yield (UGY) (kg ha-1) is an average yield of each treatment while Adjusted Grain Yield (AGY) (kg ha-1) is the average yield adjusted down ward by a 10% to reflect the difference between the experimental yield and yield of farmers. Unadjusted Straw Yield (USY) kg ha-1) is an average straw yield of each treatment. Adjusted Straw Yield (ASY) kg ha-1) is the average straw yield adjusted down ward by a 10% to reflect the difference between the experimental yield and yield of farmers. Gross Field Benefit (GFB) (ETB ha-1) was computed by multiplying field/farm gate price that farmers receive for the crop when they sell it as adjusted yield. GFB=AGY × field/farm gate price for the crop. Total Variable Cost (TVC) (ETB ha-1) was calculated by summing up the costs that vary, including the cost of urea fertilizer (1600 Birr 100 kg-1) and for each time of application cost (5 person 60 Birr/day) and the average open price of bread wheat price at Tongo market was 10.50 Birr kg-1 in January 2019 during harvesting time. The net benefit (NB) was calculated as the difference between the gross benefit and the total cost that vary (TCV) using the formula, NB=(GY × P)-TCV. Where GY × P=Gross Field Benefit (GFB), GY=Adjusted Grain yield per hectare and P=Field price per unit of the crop. Actual grain and straw were adjusted downward by 10% to reflect the difference between the experimental yield and the yield farmers could expect from the same treatment. The dominance analysis procedure as described in CIMMYT (1988) manual was used to select potentially profitable treatments from the range that was tested. The discarded and selected treatments using this technique were referred to as dominated and nominated treatments, respectively. For each pair of ranked treatments, % Marginal Rate of Return (MRR) was calculated using the formula.
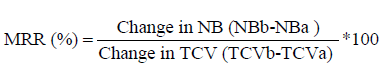
Where, NBa=the immediate lower NB, NBb=the next higher NB, TCVa=the immediate lower TCV and TCVb=the next highest TCV. The treatment with highest net benefit and MRR>100 was considered for recommendation.
Statistical Analysis
The Analysis of Variance (ANOVA) was used in the GLM procedure using SAS program 9.3 (SAS Institute, 2014). Mean separation was performed whenever treatment means are significantly different using Duncan’s Multiple Range Test (DMRT) at 5% probability level.
Selected Physico-Chemical Properties of the Experimental Site
The results indicated that the particle size distribution was 71.7% sand 14.0 silt 14.32%the soil contained sand, silt and clay of 71.7%, 14.0% and 14.37% clay (Table 1) (FAO, 2008; Olsen, 1954; Tekalign, 1991). According to the soil textural class determination triangle, the soil of the experimental site was loamy sand. The texture indicates the degree of weathering, nutrient, and water holding capacity of the soil (Kasaye, 2018). High sand content might indicate better aeration, infiltration and low nutrient holding capacity of the soil in the experimental site.
| Soil properties | Results | Rating |
|---|---|---|
| Soil textural class | ||
| Sand (%) | 71.68 | |
| Silt (%) | 14 | |
| Clay (%) | 14.32 | Loamy sand |
| Bulk density (g cm-3) | 1.3 | Moderate |
| pH (1:2.5 H2O) | 5.7 | Moderately acidic |
| Organic carbon (%) | 2.15 | Low |
| Electric conductibility | 0.13 | Salt free |
| Organic matter (%) | 3.7 | Low to medium |
| Total N (%) | 0.15 | Poor |
| Available P (mg kg-1) | 15.26 | High |
| Available K (mg kg-1) | 90.27 | Very low |
| CEC (cmol (+) kg-1) | 22.6 | Moderate |
Knowledge of soil bulk density is essential for soil management, and information about it is important in soil compaction as well as in the planning of modern farming techniques. A normal range of bulk densities for clay is 1.0 to 1.6 mg m-3 and a normal range for sand is 1.2 to 1.8 mg m-3 with potential root restriction occurring at ≥ 1.4 mg m-3 for clay and ≥ 1.6 mg m-3 for sand. Soil bulk density should be used as an indicator of soil quality parameter. The bulk density of the study area was 1.3 mg m-3 which is raged as moderate. Thus the soil may be ideal for the production of crops under appropriate management practices.
The soil pH value of the experimental site was 5.70, which is ranged as moderately acidic (FAO, 2008). The pH value obtained from the experimental site before planting was above the critical value (5.29) mentioned for wheat production (Abdulah-Al et al., 2016). Thus, the soil is suitable for the production of cereals crops including wheat. Soil organic matter is taken as a basic measure of fertility status to improve water-holding capacity, nutrient release and soil structure. Accordingly, the OM content of study soil was 3.7% is rated as low to medium (Tekalign, 1991). Low addition of crop residues to the soil in the soil might be a reason for low to medium soil OM. Therefore, regular application of organic manure such as crop residue, compost and the like is important to improve the fertility status of the soil. Moreover, the experimental site had low in total N content (0.15%), indicating that the N is a limiting factor for optimum crop growth (Singh, 2017). As wheat need high N, its production potential is highly affected by N deficiency. Therefore, there is a need to apply optimum N to the crop in order to get high crop yield.
Phosphorus helps transfer of energy from sunlight to plants, stimulates early root and plant growth, and hastens maturity. Olsen et al. (1954) classified available P content of the range <5 as (very low), 5-15 as (low), and 15-25 as (medium) and >25 mg kg-1 as (high). Hence the available P value 15.3 mg kg-1 of the soil before planting lies under the low range which is not optimum for bread wheat growth and yield. Ethiosis (2014) reported that, there is deficiency of P nutrient in the region. Available K (90.27 mg kg-1 soil) was very low as rating of Jones which may probably be due to leaching caused by high precipitation, which needs to add K fertilizer.
The CEC of the study area was 22.6 cmol (+) kg-1 (Table 1). Landon rated these values as medium. The medium CEC of the soils could be attributed to the low organic matter content in the soils as well as the nature of the parent materials from which the soils were developed and the type of the layer silicate clay minerals in the soils.
Phenological and Growth Parameters
Days to emergence: Analysis of variance revealed that the rate and timing of N application as well as their interactions did not significantly (P>0.05) affect days to emergence of bread wheat (Appendix 1). However, in this experiment, 9.07-10.00 days were required for the seedlings to emerge from the soil in different treatments. Lack of significant variation on days to emergence due to applied treatments might be due to the presence of adequate food reserves in form of cotyledons, which was available for initial plant growth. This is in conformity with finding of Melese who reported that plants depend mostly on stored food than on external nutrients to emerge.
Days to 50% heading: Analysis of variance revealed that the main effect of the N rate and timing of N application significantly (P ≤ 0.01) influenced days to 50% heading. Days to 50% heading of the plants was hastened under lower N rates compared to the higher N rates. For instance, increasing the N rates from 0-46 kg N ha-1, prolonged days to heading by about 4.82%. This showed that the most prolonged duration to heading was recorded under plant grown at the rate of 92 kg N ha-1 (88.13 days) whereas the shortest duration to heading (81.75 days) was recorded for plants grown without N application (Table 2). Moreover, delay in days to 50% heading with application of higher level of N might be due to that N increased vegetative growth which in turn delays reproductive growth. This could be related to the vigorous growth that resulted in longer number of days for heading compared with days to heading obtained for the unfertilized treatment. Generally, the number of days to 50% heading recorded over all the fertilized plots significantly higher than the control. This result is in line with the finding of Otteson et al. (2007), who reported delayed days to heading with highest N application.
| NR(kg ha-1) | N content in grain % | N content of straw% |
|---|---|---|
| 0 | 2.3 | 0.55 |
| 46 | 2.35 | 0.48 |
| 46 | 2.36 | 0.51 |
| 46 | 2.39 | 0.55 |
| 46 | 2.45 | 0.56 |
| 69 | 2.52 | 0.59 |
| 69 | 2.6 | 0.61 |
| 69 | 2.61 | 0.64 |
| 69 | 2.65 | 0.67 |
| 92 | 2.65 | 0.68 |
| 92 | 2.74 | 0.71 |
| 92 | 2.76 | 0.71 |
| 92 | 2.9 | 0.73 |
Days to 90% physiological maturity: The analysis of variance indicated that rates of N application had highly significant effect (P<0.001) on number of days to 90% maturity. The comparison of means of N rates indicated that the longest days to 90% physiological maturity was recorded with 92 kg N ha and the shortest days to 90% physiological maturity was recorded with 46 kg N ha (Table 3). Late application of N delays the synthesis of abscisic acid, promotes cytokinin activity and causes higher chlorophyll retention and photosynthesis activity in leaves for supply of photosynthates to grains (Kumar, 2013). This might be the result of the N fertilizer which increases vegetative growth of crops whereby it delays maturity time. Similar result on barley was reported by Wakene et al. (2014) who showed that higher nutrient availability and favorable soil conditions due to N fertilizer could be a possible reason for delayed phenology in N-treated plots. Namvar et al. reported that increasing in N rates significantly delays the duration of the vegetative and reproductive period what is a proof of the lengthening of the time to maturity.
| Factors | Emergency date | Days to 50% heading | Days to 90% maturity | Hectoliter weight (kghl-1) |
|---|---|---|---|---|
| N Rate (kg ha-1) | 0.73 | 0.73 | 0.73 | 0.73 |
| 0 | 9.23 | 81.75d | 135.54a | 56.28a |
| 46 | 9.15 | 85.69c | 135.77a | 55.01a |
| 69 | 9.07 | 86.94b | 135.77a | 49.08b |
| 92 | 9.3 | 88.15a | 135.77a | 49.38b |
| Mean | 8.69 | 86.52 | 135.71 | 51.72 |
| CV% | 5.17 | 0.706 | 0.22 | 12.28 |
| LSD (5%) | 0.38 | 0.5106 | 0.2505 | 6.303 |
Note: Means followed by a common letter (a, b, c, d) in a column are not significantly different at the 5% probability level by DMRT.
Late maturity help the plant for more heat accumulation and fever in higher yields, but during main rain season there is moisture stress that influence on low grain filling resulting in low yield.
Plant height: The effect of nitrogen application rate had high significant (P ≤ 0.01) on plant height (Table 4). The tallest plant height (70.61 cm) was recorded from application of 69 kg N ha-1. However, statistically significant differences were not detected between this level and 46 and 92 kg N ha-1. While, shortest plant height (65.46 cm) was observed in the control. The increase in plant height with supplied N indicates maximum vegetative growth of the plants under higher N availability due to the increase in cell elongation as N is essential for plant growth process including chlorophyll which is responsible for dark green color of leaves which enhance more vigorous vegetative growth. These findings are in agreement of findings of earlier studies (Melesse, 2017).
| Factors | Plant height (cm) | Number Tillers per m-2 | Spike length (cm) | Number of kernels spike-1 | Leaf area index |
|---|---|---|---|---|---|
| N Rate (kg ha-1) | 0.2505 | 0.2505 | 0.2505 | 0.2505 | 0.2505 |
| 0 | 65.46b | 105.40c | 6.98c | 32.6c | 2.46c |
| 46 | 69.01a | 148.12b | 7.99a | 39.68b | 3.20b |
| 69 | 70.61a | 183.71a | 8.11a | 45.95a | 3.36ab |
| 92 | 70.74a | 145.46b | 7.78b | 47.74a | 3.76a |
| Mean | 70.16 | 154.96 | 7.88 | 38.27a | 3.37 |
| CV% | 2.12 | 5.37 | 3.195 | 3.86 | 12.22 |
| LSD (5%) | 1.78 | 6.97 | 0.21 | 3.21 | 0.4102 |
Note: Means followed by a common letter (a, b, c, ab) in a column are not significantly different at the 5% probability level by DMRT.
Leaf area index: The effect of N rates had highly significant (P ≤ 0.001) influence on leaf area index (Appendix 2). Leaf area index is major factor determining photosynthesis and dry matter accumulation. It has primary importance in increasing the yield of cereals including wheat. Maximum leaf area index (3.76) was observed with 92 kg N ha-1 and it was statistically at par with 69 kg N ha-1. Whereas, the minimum value of leaf area index (2.46) was recorded from the control (Table 4). Generally, an increasing trend in leaf area index was observed with increased N application rates which might be due to improved leaf expansion in plants with optimum nitrogenous fertilizers. In line with this result (Alley et al., 2009; Assefa et al., 2012) reported that increased leaf area index with the increasing rate of N.
Yield and Yield Related Parameters
Number of productive tillers: Cereal plants with higher number of tillers could have higher grain, straw and biological yields (Shahzad et al., 2017). The analysis of variance indicated that the effects of rates of N application had highly significant effect (P<0.001) on number of total tillers m2 (Appendix 2). Generally, an increasing trend in number of productive tillers was observed from (0-69 kg ha-1) with increased N application rates which might be due to improved leaf expansion in plants with optimum nitrogenous fertilizers. In line with this result Hulef and Muleta reported on rice, there is a decrease in number of productive tillers as nitrogen fertilizer rate exceeds crops optimum level requirement. Simelar result have been observed by otheer scholars (Alley et al., 2009; Assefa et al., 2012) that increased leaf area index with the increasing rate of N. Under field conditions, the application of nitrogen (N) fertilizer is the most common and effective way to enhance the tiller population, as it increases the cytokinin content within tiller nodes and further enhances the germination of the tiller primordium (Liu et al., 2011)
The application of N fertilizer may increase the number of productive tillers; however, not every tiller contributes similarly to high productivity (Sahu et al., 2004). In our finding we have observed that there is hiegher number of productive tillers when optimum 69 kg ha-1.
Spike length: The statistical analysis results revealed that spike length was highly significantly (P<0.01) affected by the effect of N rate (Appendix 2).
Means comparison of N rates indicates that the length of spike increase significantly with increasing of N. The longer spike length (8.11 cm) was obtained from application of 69 kg N ha-1, which is 16.19% longer than the control (Table 3). The minimum spike length (6.98 cm) was recorded from the control. This could be due to the role of the essential nutrients in enhancing the seed holding capacity of the spike. When N rates increased from zero up to 69 kg N ha-1, the spike length also increased but no further increase with rate of 90 kg N ha-1. This might be a toxic effect of excess N on wheat growth which resulted in stunted growth and reduced spike length (Bekalu et al., 2016). This result is in line with the finding of many scholars who reported that spike length of bread wheat was significantly increased with increasing the amount of N (Ali et al., 2011; Abdulkerim et al., 2015; Shahzad et al., 2017; Singh, 2017).
Number of kernels spike-1: The yield potential of wheat spike is determined by the kernels spike-1 which is an important yield component of grain yield. Kernels number spike-1 was highly significantly (P<0.001) different among the N rates (Appendix 2).
The highest number of kernels spike-1 (47.74) was obtained at N level of 92 kg ha-1 while the lowest number of kernels spike-1 was obtained from the control (Table 4). However, at 69 and 92 kg ha-1 N levels the numbers of kernels spike-1 were statistically similar. This can be justified with a reason that N availability satisfied the plant requirement for growth and development at 69 kg ha-1, which enable the plants to produce more number of kernels spike-1. Increased number of kernels spike-1 might be due to optimum plant stand with better N nutrition. Better nutrition enhanced the source capacity to better fill the sink (Iqbal et al., 2012). Our results are in line with the findings of Baethgen et al. (1995) who observed that increase number of kernels spike-1 by the increasing rate of mineral N.
Thousand kernels weight: The analysis of variance indicated that the effects of N application rates had strongly significant (P<0.001) (Appendix 2).
Among the N levels, the highest thousand kernels weight (35.38 g) was produced when the N was applied at the rate of 69 kg ha-1 while the lower thousand kernels weight (29.30 g) was recorded at the control (Table 3). This significant influence of different levels of nitrogen fertilization over the lower levels was observed because of N formation of plant height and shoot length under higher rates of N (Yadav et al., 2017). These results indicate that N has a key role in the growth and development of grain. Furthermore, the higher thousand kernels weight with increasing N levels might be due to the higher availability of N and the crop’s efficient use of N. This result is in line with those of Geremew, who reported that addition of N increases the grain weight of durum wheat.
Regarding timing of N application, the highest thousand kernels weight (34.79 g) was recorded at application of N as T3 (20:50:30% N at planting, mid-tillering and anthesis), and it was statistically at par with application of N as T2 (50:50% N at planting and mid-tillering) and T1 (30:70% N at planting and mid-tillering). However, the minimum of this trait was recorded at application of N as T4 (50:50% N at planting and anthesis) and it was also statistically at par with application of N as T2 (50:50% N at planting and tillering) and T1 (30:70% N at planting and mid-tillering). Though many investigations are recommending two split applications there is still variation in the proportion and timing of the N fertilizer at each applications. There are a number of reports which are recommending three and four times split applications for cereal production.
Grain yield: The result regarding grain yield showed that there were highly significant (p<0.001) differences in grain yield among N rates and timing of N application. Interaction among rates and timing of N application was also significant (p<0.01) (Appendix 2).
The maximum grain yield (5.4 t ha-1) was obtained in response to N applied at rate of 69 kg N ha-1 with twotime equal split T2 (50:50 N at planting and tillering). However, the lowest grain yield (2.6 t ha-1) was recorded from plots treated with 46 kg N ha-1 with T1 (30:70 N at planting and mid-tillering). In conformity with this result, Tilahun, et al. (2008) reported the highest grain yield was obtained in response to application of 69 kg N ha-1 in two equal split doses at sowing and mid-tillering on durum wheat. N fertilizer application time had significant effect on grain yield (Table 3). Regardless of the N rates, application of two-time equal split T2 (50:50 N at planting and tillering) resulted in higher grain yield than the other treatments (Figure 3). Among N rates, maximum grain yield was produced when N applied at the 69 kg ha-1 while lower grain yield was recorded with lower N rates 46 kg N ha-1 (Figure 3). More interestingly application of N at the rate of 92 kg N ha-1 resulted in decreased grain yield. In line with the result of this study (Hachiya et al., 2017; Baligar et al., 2001) also reported that N fertilizer beyond the maximum nutrient requirement level of the crop resulted either in lodging or decline in yield. Getachew (2017) reported, due to the positive effect of N on yield components such as number of tillers plant-1 and number of spikelet panicle- 1 increased grain yield can be obtained. The increments in yield of wheat with increasing N rates up to 69 kg ha-1 might be attributed to the effective role of N as an essential constituent of chlorophyll on dry matter accumulation. Our findings are in agreement with observa¬tions made by many researchers such as (Destro et al., 2001; Ward, 2015; Zebarth et al., 2007) who reported that grain yield increased with increasing N rates. The highest grain yield at the higher N rates might have resulted from improved root growth and increased uptake of nutrients and better growth that enhanced yield components and yield.

Figure 3. The interactions effect of Rate and time N application on grain yield. Note: Vertical bars represent ± standard error (SE,
n=3). Note: Application time ( ) T1; (
 ) T2; (
 ) T3; (
 ) T4.
) T4.
Straw yield: Straw yield is an important parameter because farmers are also interested in straw in addition to grain. Straw of bread wheat plant is important for nutrient cycling, livestock feed and construction material for the farmers those residing in the area. The analysis of variance indicated that the main effects of rates and timing of N application had highly significant effect (P<0.01) on straw yield. Likewise, their interaction effect also revealed highly significant (P<0.01) differences on the straw yield (Appendix 2).
The maximum straw yield of 7.6 t ha-1 was obtained when bread wheat plants were treated with 69 kg N ha-1 in two split doses T2 (50:50 at planting and at mid tillering) and it was statistically at par with 92 kg N ha-1 with T4 (50:50 at planting and anthesis) and 46 kg N ha-1 with T1 (30:70 at planting and at mid tillering) (Figure 4). Whereas, the lowest straw yield was recorded under 46 kg N ha-1 applied in double split (50:50 at planting and at anthesis) but ststically at par with 69 kg ha-1 combined with equal split T4 (50:50 at planting and at anthesis).The low result at equal split application due to lodging, toxicity as well as the final application was efficiently utilized at grain filling stage; because the yield is greater than two split T1 (30:70 at planting and anthesis) application. Other possible reason could be shortage of rain fall at anthesis split application and loss of nitrogen might have occurred by leaching and volatilization as it was applied on the surface. Similar results were reported by (Tilahun, et al., 2008).

Figure 4. Interaction effect of Nitrogen Rate and Nitrogen timing on number of straw yield of bread wheat. Note: Vertical bars represent ± standard error (SE, n=3). Note: ( ) T1; (
 ) T2; (
 ) T3; (
 ) T4.
) T4.
Biological yield: The potential of a crop depends upon its biomass production. Biological yield (total biomass produced by a crop from the unit area) was highly significantly (P<0.001) affected by rates and timings of N application as well as by their interaction (Appendix 2)
Maximum biological yield (12.984 t ha-1) was observed in those plots where the N rates was kept at 69 kg ha-1 and applied as T2 (50:50% N at planting, mid-tillering) and it was statistically at par with T4 and T1 as well as N rates 46 and 69 kg ha-1 and applied as T3 and T2 respectively (Figure 5). Whereas, the lowest biological yield was recorded under 92 kg N ha-1 applied in triple split (20: 50:30 of N at planting and mid-tillering and anthesis. The current result is in line with the finding of Tilahun et al., 2008; Assefa et al., 2012; Sadeghi et al., 2015; Shahzad et al., 2017; Opinder, 2017 who indicated that higher biological yield was obtained when N is applied in optimum rates and right time.

Figure 5. Effects of N rate and N application time on biological
of bread wheat grown under field conditions in 2018
cropping season. Note: Vertical bars represent ± standard
error (SE, n=3). Note: ( ) T1; (
 ) T2; (
 ) T3; (
 ) T4.
) T4.
Diseases Insects and Abiotic Factor
Lodging index: The main effect of rate of nitrogen fertilizer application had highly significant (P ≤ 0.001) influence on lodging index. However, the interaction effect and N timing had no significant effect on lodging index (Appendix 2).
From the lodging indices calculated, the lodging was much attributed to N, and other physical factors can also hasten it. Together with prevailed windy and excessive rain fall condition at the experimental site during grain filling period, plants of relatively weaker stems and those which were very tall in height might have been exposed to lodging. Highest lodging index (3.411) was recorded in the plots which received the maximum N rates whereas the smallest value of lodging index was observed in the control treatment. Literatures indicate that when crops receive large amount of N their physical strength decreases according to reports of Wakene et al. (2014) that have been conducted on barley. On the other hand, moisture saturated soil at the experimental site might be another reason for highly grown plants to lodge, because it might affect strength of root anchorage. There was a tendency of decrease in yield as when amount of N was above the optimum as lodging index increase reversely.
Harvest index: The physiological efficiency and ability of a crop for converting the total dry matter into economic yield is indicated in harvest index. The result revealed that there were highly significant (P<0.01) differences in harvest index among rates and time of N application. Interaction among rates and times of N application was also highly significant (P<0.001) (Appendix 2).
The highest harvest index was recorded from 69 kg N ha-1 at the two split application of 50:50% N at planting and mid-tillering stage, and it was statistically at par with the combination of 92 kg N ha-1 at the same application time. In contrast, the lowest harvest index was obtained from the 46 kg N ha-1 at the two split application of 30:70% N at planting and mid-tillering stage. The highest harvest index at 69 kg N ha-1 might be that greater improvement in grain yield compared to the corresponding increase in biomass yield, while the highest N rate (92 kg N ha-1) gave more biomass than the grain yield. In line with this results Nakano et al. (2015) reported that greater synchrony between crop demand and nutrient supply is necessary to improve nutrient use efficiency, and two split applications of N during the growing season, rather than single, more application are known to be effective in increasing N use efficiency and plants uses nutrients effectively.
Additionally, the significant N rate and timing interaction indicates HI responses to N application that time variation exists in response of N application. Thus all N rates, the best split application was found to be 50% at planting and 50% at tillering (Figure 6). There are several reports on this finding (Tran et al., 2000; Liu et al., 2006; Rankinen et al., 2007; Wicaksono et al., 2013; Wakene et al., 2014; Nakano et al., 2015; Sadeghi et al., 2015; Bekalu, 2016; Efretuei et al., 2016; Li et al., 2016; Muthaura et al., 2017; Girma et al., 2018).

Figure 6. The interaction effect of Nitrogen rate and timing
on harvest index for 2018 bread wheat grown in main rainy
season. Note: Vertical bars represent ± standard error (SE,
n=3).Note: ( ) T1; (
 ) T2; (
 ) T3; (
 ) T4.
) T4.
Nitrogen-Use Efficiency and NUE Components of Bread Wheat
Nitrogen use efficiency: The result showed that the main effect of N rate and N timing had highly significant (P<0.01) effect on the nitrogen use efficiency. However, their interaction effects were not significant (Appendix 3).
Among the different N levels of application 69 kg ha-1 shows the highest(42.63 kg kg-1) NUE, while the lowest (27.92 kg kg-1) is recorded in 92 kg ha-1 and at par with 46 kg kg-1. The data shows as N rate increases from 0-69 kg ha-1 N NUE increased and decline at 92 kg ha-1 of N application. Nitrogen use efficiency is greater when the yield response to N is high. Therefore, this efficiency is generally high with low N rates and decreases in accordance with the rate increase of applied. Similar results have been recorded by (Baligar et al., 2001; Efretuei et al., 2016; Zebarth et al., 2007). The highest (56.78 kg kg-1) NUE obtained for time of application was recorded at two split (50:50% N at planting and tillering) applications of all N rates. Stage of plant development is critical in the management of N applications, because different physiological growth parameters are affected at different growth stages of plant development (Table 5).
| Treatments | Nitrogen use efficiency | nitrogen utilization efficiency | physiological efficiency | Apparent nutrient recovery efficiency |
|---|---|---|---|---|
| N rates (kg ha-1) | ||||
| 0 | 0 | 34.79b | 6.45 | 30.78a |
| 46 | 34.93ab | 49.01a | 79.62 | 41.46a |
| 69 | 42.63a | 48.95a | 87.79 | 41.68a |
| 92 | 27.91b | 43.89ab | 82.45 | 40.91a |
| Application time | ||||
| T1 | 16.03c | 40.55b | 56.89b | 28.62b |
| T2 | 56.78a | 55.94a | 110.2a | 52.49a |
| T3 | 44.75b | 53.92a | 93.79a | 54.55a |
| T4 | 23.08c | 38.72b | 72.27a | 32.07b |
| Mean | 32.45 | 44.16 | 77.2 | 38.71 |
| CV% | 27.77 | 17.39 | 26.57 | 36.8 |
Note: Means followed by a common letter (a, b, c, ab) in a column are not significantly different at the 5% probability level by DMRT.
Agronomic use efficiency: Agronomic use efficiency is described as the economic production obtained per unit of nitrogen applied. The analysis of variance showed that agronomic efficiency was highly significantly (P ≤ 0.01) affected by the main effect of N rate and time of application and their interactions(P<0.05) (Appendix 3).
The highest agronomic efficiency (106.61 kg grain yield kg-1N) was obtained when 69 kg N ha-1 of N fertilizer was applied at two equal split T2 (50:50% at planting and at mid-tillering) application and it was statistically at par with the 92 kg N fertilizer application (Figure 7). On the other hand, the lowest agronomic efficiency (18.39 kg grain yield kg-1N) was recorded at 46 kg N ha-1 in two split T1 (30:70% at planting and at mid tillering) application of nitrogen and at par with the 92 kg N rate with the same time of application.

Figure 7. The interaction of Nitrogen rate and timing effect
on agronomic efficiency for bread wheat grown 2018 main
rainy season. Note: Vertical bars represent ± standard error
(SE, n=3). Note: ( ) T1; (
 ) T2; (
 ) T3; (
 ) T4.
) T4.
Decline in agronomic efficiency at higher level of N may be attributed to nutrient imbalance and decline in indigenous soil N supply. In agreement with this result, several studies asserted that high agronomic efficiency is obtained if the yield increment per unit N applied is high because of reduced losses and increased uptake of N (Hirel et al., 2011; Assefa et al., 2012; Singh, 2017). Other scholars also found that, higher fertilizer use efficiency which is always associated with low fertilizer rate (Jiang et al., 2015). Thus, the goal of N-fertilizer research has to maintain high levels of crop productivity with minimum nitrogen input, i.e. to improve the agronomic efficiency of N. Agronomic efficiency of N can be increased by increasing plant uptake and use of N and by decreasing N losses from the soil-plant system. Agronomic approaches, such as fertilizer placement, proper level of fertilizer application in optimum plant density, time of fertilizer application and use of nitrogen efficient varieties are some of the practices that can be used to improve nitrogen use efficiency (Bingham et al., 2012). The results on both N agronomic efficiency are supported by the effects of N fertilization on yields, nutrient recovery and the soil analysis result before planting.
Nitrogen utilization efficiency: Nitrogen Utilization Efficiency (NUEF) was also highly and significantly (p ≤ 0.01) affected by the N timing and N rates (Appendix 3). However, have no interaction effect.
Thus, the highest for N level is recorded in 46 kg ha-1 with (49.01 kg kg-1N) NUEF (Table 4). The highest NUEF obtained in N rates exceeded the lowest (34.79 kg kg-1) by 40.87%. This might be due to addition of extra fertilizer for better growing conditions. The highest (32.61 kg kg-1N) and the lowest (25.15 kg kg-1N) NUEF values were obtained from the application of 46 and 0 kg N ha-1, respectively. This indicates that the plant produced about 25.15 kg wheat grain yield per 1 kg of total plant N and about 32.61 kg wheat grain yield for every kg N it had in the total biomass, respectively. The efficiency significantly dropped when N application level changed from 69 to 92 kg N ha-1.The decrease in N utilization efficiency was by 40.87%, 0.225% and 10.34%, in that order, when fertilizer application levels increased from 0 to 46, from 69 to 92 kg N ha-1, respectively (Table 4). Similarly other reported same results (Nano, 2017; Wang et al., 2017).
The highest result NUEF for N timing where 55.94 kgkg-1 at double application (50:50% at planting and at mid-tillering of the plant growth stage whereas the smallest was 38.72 kg kg-1 at double application (50:50% at planting and at anthesis of the plant growth stage which shows huge loss of untimely applied N fertilizer.
Physiological efficiency: Physiological efficiency (PA) was also highly and significantly (P ≤ 0.01) affected by the N timing alone (Appendix 3). However, have not influenced by N rate and the interactions of the two factors.
Physiological efficiency represents the ability of a plant to transform N acquired from fertilizer into economic yield (grain) (Muthaura et al., 2017; Singh, 2017). The maximum PE (110.20 kgkg−1) was observed for double split application (50:50% N at planting and tillering).the lowest (56.89 kgkg-1) was recorded at split application of (30:70% N at planting and mid-tillering).This may be the extra 70% applied at mid tillering or after 25 days after sowing is in inappropriate amount that leads to wastage.
Apparent nitrogen recovery efficiency: The analysis of variance indicated that Apparent Nutrient Recovery efficiency (ANR) was significantly influenced (p<0.01) by N rate, N timing but not by their interactions (appendix 3).
Apparent Nutrient Recovery efficiency (ANR) has been used to reflect plant ability to acquire applied nutrient from soil (Baligar et al., 2001). It depends on the harmony between plant N demand and the quantity of N released from applied N (Baligar et al., 2014).
The highest apparent nitrogen Recover efficiency recorded at N rate of 69 kg ha−1 in which statistically at par with that 46 and 92 kg ha-1 of N rate, while the lowest apparent recovery efficiency (30.78%) was recorded from control treatment (Table 4). The data reveled that a decreasing trend after 69 kg ha-1 in ANR with increasing N rates.
The highest (54.55%) for N timing was recorded in thrice split application T3 (20:50:30%N at planting, mid tillering and anthesis) but statically at par withT2 (50:50: at planting and at mid-tillering). As number of split application increases apparent nutrient efficiency of the bread wheat shows the tendency of increase until the optimum rate of N application rate.
In general, the apparent recovery efficiency obtained from this study ranged between 41.68 and 30.78% for the different N timing under the different N rates. However, the common apparent recovery N efficiency values ranging between 30% and 50%, and 50% and 80% indicate well-managed system (Gaju et al., 2011). Similar findings reveal same result (Baligar et al., 2001; Stahlman, 2009; Baligar et al., 2014; Lauer et al., 2011) (Table 6).
| ED | DH | MD | PH | SL | NTT | NSS | NKP | BY | GY | TSW | HI | SY | LAI | |
|---|---|---|---|---|---|---|---|---|---|---|---|---|---|---|
| ED | 1 | 0.27ns | 0.57*** | 0.67*** | 0.78ns | 0.34ns | 0.85ns | 0.01** | 0.54*** | 0.63*** | 0.91** | 0.55** | 0.84** | 0.88** |
| DH | 1 | 0.34** | -0.40** | -0.25ns | -0.34** | -0.26ns | 0.18ns | -0.17ns | -0.39** | -0.10ns | -0.27* | 0.03ns | -0.09ns | |
| MD | 1 | 0.93*** | 0.30* | 0.42*** | 0.33* | -0.34** | 0.65** | 0.54*** | 0.46*** | 0.53*** | 0.29* | 0.43** | ||
| PH | 1 | 0.25ns | 0.49*** | 0.38*** | -0.33* | 0.66** | 0.52** | 0.51*** | 0.54*** | 0.36* | 0.48** | |||
| SL | 1 | 0.46*** | 0.50*** | -0.04ns | 0.18ns | 0.44*** | 0.27* | 0.48** | 0.10ns | 0.27* | ||||
| NTT | 1 | 0.55*** | -0.22ns | 0.32* | 0.44*** | 0.37** | 0.53*** | 0.21ns | 0.36* | |||||
| NSS | 1 | -0.17ns | 0.25ns | 0.40** | 0.39** | 0.66*** | 0.23ns | 0.39* | ||||||
| NSP | 1 | -0.15ns | -0.20ns | -0.13ns | -0.34** | -0.06ns | -0.12ns | |||||||
| BY | 1 | 0.33* | 0.81*** | 0.39** | 0.73** | 0.80ns | ||||||||
| GY | 1 | 0.31* | 0.60** | -0.10** | 0.31** | |||||||||
| TSW | 1 | 0.52** | 0.91** | 1.00*** | ||||||||||
| HI | 1 | 0.28* | 0.51** | |||||||||||
| LAI | 1 | 1 |
Note: RM; ns=not significant; *Significance at the 5% level. **Significance at the 1% level. ***Significance at the 0.1% level; DH=Date of Heading; DM=Date of Maturity; NTT=Total tillers Number; SL=Spike Length; BY=biological yield; GY=Grain Yield; SY=straw yield; TSW=Thousand Seed Weight and HI=Harvest Index; NKP=number of kernels per spike.
Partial Budget Analysis of N Fertilizer Rate and Time proportion of split Application
Farmers gives priority for the least cost that incurred in buying fertilizer applied than the yield because their low income. So the objective not only to increase yield limited alone, but also to make a profit out of it. Towards maximizing profit, the amount and time of fertilizer application as well as the costs of fertilizer are determining factors (CIMMYT, 1988). In the study area the demand and market price of bread wheat is crucial. Due to this fact increasing both grain yield and biomass yield can increase farmers’ income.
As indicated in the Table 7, the partial budget analysis showed that the highest net benefit of 53,486.9 Birr ha-1 was obtained in the treatment that received 69 kg N ha-1 in to two split application of 50:50% N at planting and tillering stage. However, the lowest net benefit 24,908.7 Birr ha-1 was obtained from control treatment. The highest marginal rate of return (3150.70%) was obtained from the plot treated with 92 kg N ha-1 in two split application of N T1 (50:50% at planting and mid-tillering stage). Marginal analysis was performed on non-dominated treatment. The minimum rate of return (MRR) acceptable to farmers is between 50% and 100% (CIMMYT, 1988). Two results at 46 kg (92.29%) and 69 kg (80.00%) with combination of T1 (50:50 at planting and at mid-tillering shows minimum acceptable return (MRR). The MRR the experiment (46% and 69% kg N ha-1 50:50% N at planting and mid-tillering) application time would be the best recommendation for farmers. Both statistical and economic analysis results for N rate were the same. statically double split application T2 (50:50% at planting and at active tillering stage is the best yield (5.4 t ha-1) than the other time of application result obtained without additional cost over the recommended; the interactions also shows the highest yield (5.4 t ha-1) at 69 kg ha-1 (Table 8). Thus best of all economically as well biological result obtained for farmers recommendation is 69 kg with double split application of 50% planting and 50% at the active tillering stage. Also the 46 kg N ha-1 with 92.29% MRR is acceptable due to its low cost can be recommended for poor farmers in the experimental area (Maokom special district in benshangul gumuz of Ethiopia) and district of similar agro-ecological condition.
| GY | NUEF | AE | PE | ANR | |
|---|---|---|---|---|---|
| GY | 1 | 0.66422*** | 0.999*** | 0.780*** | 0.63*** |
| NUEF | 1 | 0.66*** | 0.88*** | 0.54*** | |
| AE | 1 | 0.77*** | 0.62*** | ||
| PE | 1 | 0.46*** | |||
| ANR | 1 |
Note: NUEF=Nitrogen Utilization Efficiency; AE=Agronomic Efficiency; PE=Physiological Efficiency; ARE=Apparent nutrient Recovery Ratio; ***Significance at the 0.1% level.
| Treatments | Fertilizer cost (BIRR) | fertilizer cost (BIRR) | Total variable Cost (BIRR) | Gain yield (kg ha-1) | Adjusted grain yield (10%) drawn (kg ha-1) | Total revenue (TR) grain yield (*10.50 ETB) | Net revenue (TR-TVC) | Marginal rate return ratio | Marginal rate return Rate | |
|---|---|---|---|---|---|---|---|---|---|---|
| NR | NT | |||||||||
| 0 | 0 | 0 | 0 | 0 | 2156.6 | 2372.26 | 24908.7 | 24908.7 | 0 | 0 |
| 46 | T1 | 1600 | 1000 | 2600 | 2587.2 | 2845.92 | 29882.2 | 27282.2 | 0.913 | 91.29 |
| 46 | T2 | 1600 | 1000 | 2600 | 3622.1 | 3984.31 | 41835.3 | 39235.3 | 4.6 | 459.73 |
| 46 | T3 | 1600 | 1480 | 3080 | 3239.6 | 3563.56 | 37417.4 | 34337.4 | D | D |
| 46 | T4 | 1600 | 1000 | 2600 | 2654.7 | 2920.17 | 30661.8 | 28061.8 | D | D |
| 69 | T1 | 2400 | 1020 | 3420 | 2744.7 | 3019.17 | 31701.3 | 28281.3 | 0.7989 | 79.89 |
| 69 | T2 | 2400 | 1020 | 3420 | 4927 | 5419.7 | 56906.9 | 53486.9 | 31.51 | 3150.7 |
| 69 | T3 | 2400 | 1500 | 3900 | 4207 | 4627.7 | 48590.9 | 44690.9 | 18.325 | 1832.5 |
| 69 | T4 | 2400 | 1020 | 3420 | 3352.1 | 3687.31 | 38716.8 | 35296.8 | D | D |
| 92 | T1 | 3200 | 1040 | 4240 | 2879.7 | 3167.67 | 33260.5 | 29020.5 | D | D |
| 92 | T2 | 3200 | 1040 | 4240 | 4319.5 | 4751.45 | 49890.2 | 45650.2 | 20.28 | 2028.01 |
| 92 | T3 | 3200 | 1520 | 4720 | 4004.6 | 4405.06 | 46253.1 | 41533.1 | D | D |
| 92 | T4 | 3200 | 1040 | 4240 | 2992.2 | 3291.42 | 34559.9 | 30319.9 | D | D |
Note: NR=Rate of nitrogen in kg ha-1, NT=Time of N application; AGY=Adjusted grain yield; ASY=Adjusted straw yield; GFB=Gross field benefit; TVC=total variable cost; NB=Net benefit; MRR=Marginal rate of return; D=Dominated treatments. Market price of bread wheat 10.50 ETB kg-1; Cost of Urea=1600 ETB ha-1; Labor cost for application of nitrogen=8 persons ha-1; each 60 ETB day-1; Price of straw=0.20 cents kg-1, D=Dominated treatments.
Net benefit curve (actually, a series of lines) connects these points. The net benefit curve is useful for visualizing the changes in costs and benefits in passing from one treatment to the treatment of next highest cost. The net benefit curve also clarifies the reasoning behind the calculation of marginal rates of return, which compare the increments in costs and benefits between such pairs of treatments. Before proceeding with the net benefit curve and the calculation of marginal rates of return, however, an initial examination of the costs and benefits of each treatment, called dominance analysis, may serve to eliminate some of the treatments from further consideration and thereby simplify the analysis. Dominance analysis is thus carried out by first listing the treatments in order of increasing costs that vary. Any treatment that has net benefits that are less than or equal to those of a treatment with lower costs that vary is dominated (Figure 8).

Figure 8. Net benefit curve of bread wheat as influenced by nitrogen fertilizers at Maokomo special district. The curve shows MRR.
Wheat is one of the major staple and food security crops in Ethiopia in terms of both production and consumption. However, it yield appears to below due to many production constraints such as minimum use of improved varieties, diseases, weeds, and low soil fertility and lack of location specific fertilizer recommendation in Ethiopia in general and in Western Ethiopia specifically in Benshangul Gumuz Regional State (BGRS).
Farmers in this area apply N fertilizer in the form of urea at sub-optimal blanket rates and use low amounts of nitrogen in the form of urea only one time at sowing for bread wheat production. Therefore, field experiment was conducted during the 2018 main cropping season at Tongo sub-site Assosa agricultural Research Center to assess the effect of nitrogen fertilizer rates and time of application on yield and yield components ; and to determine economically appropriate rates of nitrogen and time of application for bread wheat production. The experiment was laid out as a Randomized Complete Block Design (RCBD) in a factorial arrangement with four replications using a Bread wheat variety ‘Shorima’ as a test crop.
The treatments consisted of three levels N (46, 69 and 92 kg ha-1), four nitrogen fertilizer application time in different split proportion (T1=30:70% N at planting and mid-tillering; T2=50:50% N at planting and mid-tillering; T3=20:50:30% N at planting, mid-tillering and anthesis, respectively and T4=50:50% N at planting and anthesis stages) with one treatment without nitrogen fertilizer application as the control.
Analysis of the results revealed that days to 90% maturity, Harvest index, and biological yield, straw yield, grain yield, and agronomic efficiency were significantly affected by main effect as well by interactions; while plant height and spike length leaf area index and days 50% heading, number of kernels, thousand kernel weight, NUE, PE and ANR were affected by main effect of nitrogen rates alone and timing.
The maximum days to 50% heading (88.15 days), days to maturity (137 days), plant height (70.61 cm), spike length (8.11 cm) and biological yield (12.97 t ha-1), leaf area index (3.76) were recorded at N rate of 69 kg N ha-1 application.
For N timing, days to 90% maturity (87.5 days) and biological yield (12.51 t ha-1) and tiller number per m2 (149.75) were obtained from two time of nitrogen application (50:50% N at planting, mid-tillering) and two time of nitrogen application (30:70% N at planting, mid-tillering stage).
The maximum thousand kernel weight (38.35 g), grain yield (5.42 t ha-1) and harvest index (73.51) were recorded at combination of 69 kg N ha-1 in to two split application (50:50% N at planting, mid-tillering stage). The highest agronomic efficiency (106.6 kg grain yield kg-1 N) was recorded at combination of (69 kg N ha-1) rates and two split application of (50:50% N at planting and tillering).
The partial budget analysis revealed that combined applications of 69 kg N ha-1 with two split 50:50% N at planting, mid-tillering stage gave the best economic benefit (53486.9 Birr ha-1) with MRR of 79.89%. Therefore, it can be concluded that the use of 69 kg N ha-1 in two split applications (50:50% N at planting and tillering stage) can be tentatively recommended for farmers for production of bread wheat in the study area and other areas with similar agro-ecological conditions. However, it is advisable to undertake further research across soil type, years and locations to draw sound recommendation on a wider scale.
Abdulkerim J, Tana T, Eticha F (2015). Response of bread wheat (Triticum aestivum L.) varieties to seeding rates at Kulumsa, South Eastern Ethiopia. Asian J Plant Sci. 14(2): 50. [CrossRef] [Google Scholar]
Abebe B, Abebe A (2016). Effect of the time of N-fertilizer application on growth and yield of wheat (TriticumAestivum L.) At Gamo-Gofa Zone, Southern Ethiopia. Can. J. Agric. Crop. 1(2): 60-69. [Google Scholar]
Abera K, Tana T, Takele A (2020). Effect of rates and time of nitrogen fertilizer application on yield and yield components of Sorghum [Sorghum bicolor (L.) Moench] at Raya Valley, Northern Ethiopia. Int. J. Plant Breed. Crop Sci. 7(1): 598-612. [Google Scholar]
Agegnehu G, Lakew B, Nelson PN (2014). Cropping sequence and nitrogen fertilizer effects on the productivity and quality of malting barley and soil fertility in the Ethiopian highlands. Archives of Agronomy and Soil Science. 60(9): 1261-1275. [CrossRef] [Google Scholar]
Ahn PM (1993). Tropical soils and fertiliser use. Longman Scientific and Technical. Ahn S, Anderson JA, Sorrells ME, Tanksley S1 (1993). Homoeologous relationships of rice, wheat and maize chromosomes. Mol Gen Genet. 241(5): 483-490. [CrossRef] [Google Scholar] [PubMed]
Ali A, Syed AA, Khaliq T, Asif M, Aziz M, Mubeen M. Effects of nitrogen on growth and yield components of wheat. (Report). InBiol Sci. 3(6): 1004-1005. [Google Scholar]
Alley MM, Scharf PC, Brann DE, Baethgen WE, Hammons JL (2009). Nitrogen management for winter wheat: Principles and recommendations. [Google Scholar]
Baethgen WE, Christianson CB, Lamothe AG (1995). Nitrogen fertilizer effects on growth, grain yield, and yield components of malting barley. Field Crops Res. 43(2-3): 87-99. [CrossRef] [Google Scholar]
Baligar VC, Fageria NK, He ZL (2001). Nutrient use efficiency in plants. Commun Soil Sci Plant Anal. 32(7-8): 921-950. [CrossRef] [Google Scholar]
Baquy M, Li JY, Xu CY, Mehmood K, Xu RK (2017). Determination of critical pH and Al concentration of acidic Ultisols for wheat and canola crops. Solid Earth. 8(1): 149-59. [CrossRef] [Google Scholar]
Barraclough PB, Lopez-Bellido R, Hawkesford MJ (2014). Genotypic variation in the uptake, partitioning and remobilisation of nitrogen during grain-filling in wheat. Field Crops Res. 156: 242-248. [CrossRef] [Google Scholar] [PubMed]
Benishangul Gumuz region Ethiopia food security strategy (2004). Asossa. Benishangul-Gumuz Region Food Security Strateg.
Bingham IJ, Karley AJ, White PJ, Thomas WT, Russell JR (2015). Analysis of improvements in nitrogen use efficiency associated with 75 years of spring barley breeding. Eur J Agron. 42: 49-58. [CrossRef] [Google Scholar]
Borena AD (2016). Genetic variability and association among grain yield and yield related traits of bread wheat (Triticum aestivum l). Genotypes (M.Sc Thesis).
Caldicott JJ, Nuttall AM (1979). A method for the assessment of lodging in cereal crops. J Natl Inst Agric Bot. [Google Scholar]
Central Statistical Agency (2016). Agricultural Sample Survey 2015/2016 (Vol. 1). In: Area and Production of Major Crops. Central Statistical Agency, Federal Democratic Republic of Ethiopia, Addis Ababa.
Chala G, Keneni G, Obsa Z. Soil test based phosphorous calibration for fababean (Vicia faba L.) production on nitisols in central highlands of Ethiopian. [CrossRef] [Google Scholar] [PubMed]
Chatzistathis T, Therios I (2013). How soil nutrient availability influences plant biomass and how biomass stimulation alleviates heavy metal toxicity in soils: The cases of nutrient use efficient genotypes and phytoremediators, respectively. In: Biomass Now-Cultivation and Utilization by Matovic DM. In: techOpen: Rijeka, Croatia, pp: 427-448. [Google Scholar]
CIMMYT (1988). From Agronomic Data to Farmer Recommendations: An Economics Training Manual. Mexico. D.F.
CSA (Central statistical agency) (2018). The federal democratic republic of ethiopia. In: Report on area and production of major crops (Vol. I).
Daba NA (2017). Influence of nitrogen fertilizer application on grain yield, nitrogen uptake efficiency and nitrogen use efficiency of bread wheat (Triticum aestivum L.) cultivars in Eastern Ethiopia. J. Agric. Sci. 9(7): 202-217. [CrossRef] [Google Scholar]
Destro D, Miglioranza É, Arias CA, Vendrame JM, Almeida JC (2001). Main stem and tiller contribution to wheat cultivars yield under different irrigation regimes. Brazilian Arch Biol Technol. 44(4): 325-330. [CrossRef] [Google Scholar]
Dixon J, Braun HJ, Kosina P, Crouch JH, editors (2009). Wheat facts and futures 2009. Cimmyt. [Google Scholar]
Efretuei A, Gooding M, White E, Spink J, Hackett R (2016). Effect of nitrogen fertilizer application timing on nitrogen use efficiency and grain yield of winter wheat in Ireland. Irish J Agric Food Res. 55(1): 63-73. [Google Scholar]
Ehara H, Minarsih H, Wiryawan KG, Yunus M, Ermayanti TM, Widyastuti U (2013). Improving food, energy and environment with better crops. 7th Asian Crop Science Association Conference, IPB International Convention Center, Bogor, Indonesia, 27-30 September 2011. InImproving food, energy and environment with better crops. 7th Asian Crop Science Association Conference, IPB International Convention Center, Bogor, Indonesia, 27-30 September 2011. Research Center for Bioresources and Biotechnology, Bogor Agricultural University, Indonesia. [Google Scholar]
Fairey NA, Lefkovitch LP (2001). Effect of seeding rate on seed production of perennial ryegrass after establishment with a grain companion crop in the Peace River region of north-western Canada. Can J Plant Sci. 81(2): 265-271. [CrossRef] [Google Scholar]
FAO (Food and Agricultural Organizetion) (2018). World fertilizer trend and outlook. Rome, Italy.
Gaju O, Allard V, Martre P, Snape JW, Heumez E, LeGouis J, Moreau D, Bogard M, Griffiths S, Orford S, Hubbart S (2011). Identification of traits to improve the nitrogen-use efficiency of wheat genotypes. F Crop Res. 123(2): 139-152. [CrossRef] [Google Scholar]
Hachiya T, Sakakibara H (2017). Interactions between nitrate and ammonium in their uptake, allocation, assimilation, and signaling in plants. J Exp Bot 68(10): 2501-2512. [CrossRef] [Google Scholar] [PubMed]
Harfe M (2017). Response of bread wheat (Triticum aestivum L.) varieties to N and P fertilizer rates in Ofla district, Southern Tigray, Ethiopia. Afr J Agric Res. 12(19): 1646-1660. [CrossRef] [Google Scholar]
Hirel B, Tétu T, Lea PJ, Dubois F (2011). Improving nitrogen use efficiency in crops for sustainable agriculture. Sustainability. 3(9): 1452-1485. [CrossRef] [Google Scholar]
Iqbal J, Hayat K, Hussain S, Ali A, Bakhsh MA (2012). Effect of seeding rates and nitrogen levels on yield and yield components of wheat (Triticum aestivum L.). Pak J Nutr. 11(7): 531. [CrossRef] [Google Scholar]
Jiang C, Zu C, Wang H (2015). Effect of nitrogen fertilization on growth and photosynthetic nitrogen use efficiency in tobacco (Nicotiana tabacum L.). J. Life Sci. 9(8): 373-380. [CrossRef] [Google Scholar]
Kumar M (2015). Effect of NPK levels and vermicompost on growth and yield of wheat Triticum aestivum L under normal practice and system of wheat intensification. [Google Scholar]
Lauer F, Lauer R, Kösters C, Preez Du, Amelung W (2011). Microbial residues as indicators of soil restoration in South African secondary pastures. Soil Biol Biochem. 43(4): 787-794. [CrossRef] [Google Scholar]
Li CJ, Xu ZH, Dong ZX, Shi SL, Zhang JG (2016). Effects of nitrogen application rate on the yields, nutritive value and silage fermentation quality of whole-crop wheat. Asian-Australas J Anim Sci. 29(8): 1129. [CrossRef] [Google Scholar] [PubMed]
Liu XJ, Mosier AR, Halvorson AD, Zhang FS (2006). The impact of nitrogen placement and tillage on NO, N2O, CH4 and CO2 fluxes from a clay loam soil. Plant and Soil. 280(1): 177-188. [Google Scholar]
Liu Y, Ding Y, Wang Q, Meng D, Wang S (2011). Effects of Nitrogen and 6‐Benzylaminopurine on Rice Tiller Bud Growth and Changes in Endogenous Hormones and Nitrogen. Crop science. 51(2): 786-792. [CrossRef] [Google Scholar]
Macauley H (2015). Cereal crops: Rice, maize, millet, sorghum, wheat. Feed. Africa An action plan African Agric. Transform. pp: 1-36. [Google Scholar]
Mann ML, Warner JM (2017). Ethiopian wheat yield and yield gap estimation: A spatially explicit small area integrated data approach. F Crop Res. 201: 60-74. [CrossRef] [Google Scholar] [PubMed]
Muleta D, Ryder MH, Denton MD (2017). The potential for rhizobial inoculation to increase soybean grain yields on acid soils in Ethiopia. Soil Sci Plant Nutr. 63(5): 441-451. [CrossRef] [Google Scholar]
Muthaura C, Mucheru-Muna M, Zingore S, Kihara J, Muthamia J (2017). Effect of application of different nutrients on growth and yield parameters of maize (Zea mays), case of Kandara Murang’a County. ARPN J Agric Biol Sci. 12(1): 19-33. [Google Scholar]
Nakano H, Morita S, Kusuda O (2008). Effect of nitrogen application rate and timing on grain yield and protein content of the bread wheat cultivar ‘Minaminokaori’in southwestern Japan.
Plant Prod Sci. 11(1): 151-157. [CrossRef] [Google Scholar]
Olsen SR (1954). Estimation of available phosphorus in soils by extraction with sodium bicarbonate. In: Circular no. 939. US Department of Agriculture, Washington, D.C., USA. [Google Scholar]
Otteson BN, Mergoum M. Ransom JK (2007). Inheritance of nitrogen use efficiency components in south african irrigated wheat. J Amer Soc Agr. 26: 785-804. [Google Scholar]
Rankinen K, Salo T, Granlund K, Rita H (2007). Simulated nitrogen leaching, nitrogen mass field balances and their correlation on four farms in south-western Finland during the period 2000 2005. Agric. Food Sci. 16(4): 387-406. [Google Scholar]
Rosenzweig C, Iglesias A, Yang XB, Epstein PR, Chivian E (2001). Climate change and extreme weather events; Implications for food production, plant diseases, and pests. Glob Chang Hum. Health. 2: 90-104. [Google Scholar]
Ryan J, Sommer R, Ibrikci HA (2012). Fertilizer best management practices: A perspective from the dryland West Asia–North Africa region. J Agron Crop Sci. 198(1): 57-67. [CrossRef] [Google Scholar]
Sadeghi H, Bahrani MJ (2009). Effects of crop residue and nitrogen rates on yield and yield components of two dryland wheat (Triticum aestivum L.) cultivars. Plant Prod Sci. 12(4): 497-502. [CrossRef] [Google Scholar]
Sahu KC, Kariali EK, Mohapatra PK (2004). Tiller dominance in rice is dependent on assimilate concentration of the panicle during grain filling. Indian J Plant Physiol. 9: 402-406. [Google Scholar]
SAS (Stastical analysis system) (2014). SAS/STAT user guide (Version 9.3) [Software]. Cary, NC, USA: SAS Institute Inc.Silva.
Sen S, Smith ME, Setter TL (2015). Effect of low nitrogen stress on various shoot traits of maize (Zea mays L). Int J Exptl Bot. 5(1):18-22. [Google Scholar]
Shahzad K, Akmal M (2017). Yield performance of wheat under split n application rates and timing. Sarhad J. Agr. 33(3):350-356. [Google Scholar]
Singh O (2017). Enhancing yield and nitrogen use efficiency in maize-wheat system under conservation agriculture Opinder Singh Department of Soil Science.
Stahlman PW, Olson LS, Peterson (2009). Impact of topdressing nitrogen fertilizer at boot stage on spring wheat performance. North Dakota State University, Fargo, North Dakota. 9:1-7.
Stickler FC, Wearden S, Pauli AW (1961). Leaf area determination in grain sorghum 1. Agron J 53(3):187-188. [CrossRef] [Google Scholar]
Tadesse T, Assefa A, Liben M, Tadesse Z (2013). Effects of nitrogen split-application on productivity, nitrogen use efficiency and economic benefits of maize production in Ethiopia. Int J Agric Pol Res. 1(4):109-115. [Google Scholar]
Tadesse T, Haque I, Aduayi EA (1991). Soil, plant, water, fertilizer, animal manure and compost analysis manual. [Google Scholar]
Taylor RS, Weaver DB, Wood CW, van Santen E (2005). Nitrogen application increases yield and early dry matter accumulation in late‐planted soybean. Crop Sci. 45(3):854-858. [CrossRef] [Google Scholar]
Thakur TC (2003). Crop residues as animal feed. addressing resource conservation issues in rice-Wheat Systems of South Asia. [Google Scholar]
Tigre W, Worku W, Haile W (2014). Effects of nitrogen and phosphorus fertilizer levels on growth and development of barley (Hordeum vulgare L.) at Bore District, Southern Oromia, Ethiopia.
Am J Life Sci. 2(5):260-266. [Google Scholar]
Tilahun Chibsa B, Gebrekidan H, Kibebew Kibret T, Tolessa Debele D (2017). Effect of rate and time of nitrogen fertilizer application on durum wheat (Triticum turgidum Var L. Durum) grown on Vertisols of Bale highlands, Southeastern Ethiopia. Am J Res Commun. 5(1):39-56. [Google Scholar]
Tran TS, Tremblay G (2000). Recovery of 15N-labeled fertilizer by spring bread wheat at different N rates and application times. Can J Soil Sci. 80(4):533-539. [CrossRef] [Google Scholar]
Tranavičienė T, Šikšnianienė JB, Urbonavičiūtė A, Vagusevičienė I, Samuolienė G, Duchovskis P, Sliesaravičius A (2007). Effects of nitrogen fertilizers on wheat photosynthetic pigment and carbohydrate contents. Biologija. [CrossRef] [Google Scholar]
Walsh OS, Shafian S, Christiaens RJ (2018). Nitrogen fertilizer management in dryland wheat cropping systems. Plants. 7(1):9. [CrossRef] [Google Scholar] [PubMed]
Wang Y, Lu J, Ren T, Hussain S, Guo C, Wang S, Cong R, Li X (2017). Effects of nitrogen and tiller type on grain yield and physiological responses in rice. AoB Plants. 9(2). [CrossRef] [Google Scholar] [PubMed]
Ward NC (2015). Nitrogen and water effects on canopy sensor measurements for site-specific management of crops. [Google Scholar]
Woyema A, Bultosa G, Taa A (2012). Effect of different nitrogen fertilizer rates on yield and yield related traits for seven durum wheat (Triticum turgidum L. var Durum) cultivars grown at Sinana, South Eastern Ethiopia. African J Food Agric Nutr Dev.12(3):6079-6094. [Google Scholar]
Yadav MS, Dhanai CS (2017). Effect of different doses of nitrogen and seed rate on various characters and seed yield of wheat (Triticum aestivum L.). J Pharmacogn Phytochem. 6(2):01-05. [Google Scholar]