Global Journal of Animal Breeding and Genetics received 125 citations as per Google Scholar report

Received: 05-Nov-2023, Manuscript No. GJABG-23-119258 ; Editor assigned: 08-Nov-2023, Pre QC No. GJABG-23-119258 (PQ); Reviewed: 22-Nov-2023, QC No. GJABG-23-119258 ; Revised: 03-Jan-2025, Manuscript No. GJABG-23-119258 (R); Published: 13-Jan-2025, DOI: 10.15651/2408-5502.25.12.072
The data collected from 1986 to 2019 at Adea-Berga Jersey herd improvement farm was used to estimate genetic parameters for milk production traits (Lactation Milk Yield (LMY), Daily Milk Yield (DMY) and Lactation Length (LL)). The traits were estimated by using WOMBAT software. Univariate analysis was undertaken for each trait for estimation of parameters (heritability, repeatability, and breeding values) and genetic and phenotypic correlations were estimated with bivariate analysis. The direct heritability estimates for LMY, DMY, and LL of pure Jersey dairy cows were 0.14 ± 0.00, 0.12 ± 0.04, and 0.04 ± 0.02, respectively. The repeatability of LMY, DMY, and LL were 0.33 ± 0.00, 0.40 ± 0.02, and 0.10 ± 0.02, respectively. The genetic correlations between milk productions traits varied from -0.93 ± 0.22 to 0.98 ± 0.07 while the values of phenotypic correlation ranged from -0.03 ± 0.02 to 0.82 ± 0.01. The average breeding values for LMY, DMY, and LL were 26.89 litres, 0.07 litres, and 0.09 days, respectively. Heritability values of all traits are low, therefore, the possibility to improve milk production performance would be faster through improving animal management than using genetic selection. Selection of one trait among LMY, DMY and LL traits would bring a favourable response for other traits as all are showed positive genetic correlations. In conclusion, improvement of management (feeding, disease and climate control, etc.) should be implemented for the improvement of milk production traits of pure Jersey cattle population. Selection and breeding with the use of worldwide sire semen in the farm also creates genetic variability within the herd and improves heritability, genetic correlations among milk traits and breeding values.
Breeding value, Genetic parameter, Genetic trend, Production trait, Pure Jersey cow
As Ethiopia's population rises, the demand for dairy products is predicted to soar. In response to the growing demand for dairy products, the Ethiopian government has been given the chance to increase livestock output through intensive husbandry using crossbreeds and exotic breeds (Million and Tadelle 2003, Firdessa, 2012). However, compared to East African nations like Kenya, Tanzania, and Uganda, Ethiopia's dairy industry is still underdeveloped (Hunduma, 2013).
Pure temperate breed cows were imported to start breed development programs for dairy production during the Italian colonization of Ethiopia (Aynalem 2006, Staal et al., 2008). Following that, the strategies for improving the genetic makeup of cattle were put into practice by either importing exotic cattle breeds directly from other countries or transferring genes from outside sources to alter the breed composition of local populations (Habtamu et al., 2010). However, the efficiency of their adaptation and the management of the animals in a particular environment largely impact the overall performance of these cattle in terms of milk production (Nuraddis et al., 2011).
The most popular and highly productive foreign dairy cow breeds imported into Ethiopia are the Holstein-Friesian and Jersey varieties. These breeds are significant producers of milk and income, especially in metropolitan areas. That being said, there is a lack of documentation regarding the performance of these breeds' milk production upon import and distribution to particular regions (Hunduma, 2013). Moreover, a thorough examination into the productive performance of these dairy cows is necessary in Ethiopia, especially in lowland areas (Sisay, 2015).
Large-scale private and public dairy farms in Ethiopia have employed pure Friesian and Jersey dairy breeds, despite concerns over the animals' capacity to adjust to the tropical environment (feed, disease, and temperature). The National Animal Genetics Improvement Institute (NAGII) has recruited AI bulls for the nation's genetic improvement program by using improved exotic breeds as a genetic pool (Direba, 2012).
The degree of genetic diversity in a community largely dictates an individual's capacity to genetically improve a trait. According to Edward et al., and Gebeyehu et al., genetic parameter estimations are helpful in determining the method of selection to predict direct and correlated response to selection, choosing a breeding system for future development, and computing genetic gains. The most common genetic criteria are heritability, repeatability, and genetic correlation (Yibrah, 2008).
Furthermore, precise estimates of the heritability, repeatability, and genetic correlations of economically significant traits are necessary for the development of breeding objectives and successful genetic improvement programs, as well as advanced understanding of the genetic variation among economically significant milk production traits (Solomon et al., 2002; Juma and Alkass, 2006).
According to research findings in tropical regions, Jersey breeds are known for their compact size when fully grown, resilience, adaptability, low maintenance needs, efficient feed conversion, high milk fat content, moderate heat tolerance, calm demeanor, ease of care, and favorable reproductive capabilities. These qualities have led to their selection for inclusion in tropical research and development initiatives (Njubi, 1992). Consequently, they present a promising option for integration into dairy farming systems in the Ethiopian highlands, serving as both a viable choice for intensive and large-scale dairy operations and a genetic resource for breeding improvements. Despite this potential, there remains a scarcity of data regarding the genetic parameters influencing milk production traits specifically in purebred Jersey cows across various dairy management systems in Ethiopia. Therefore, the primary objective of this investigation was to assess these genetic parameters within the context of Adea-Berga dairy research farm.
Description of the Study Area and Farm
The present study was carried out at the Adea-Berga dairy research farm, situated approximately 70 km from Addis Ababa, the capital city of Ethiopia. The farm's geographic coordinates are 9° 16’ N latitude and 38° 23’ E longitude, with an elevation of 2500 meters above sea level, experiencing a cool sub-tropical climate. Annual rainfall averages 1225 mm, with an average temperature of 18°C. Established in 1986, the farm initially introduced 400 pregnant pure Jersey heifers and 2 bulls from Denmark. Since its inception, it has focused on breeding and raising pure Jersey cattle to supply milk for dairy development projects and to serve as a bull dam station for the National Animal Genetics Improvement Institute (NAGII). In 2007, the farm's operations transitioned to the Holeta Agricultural Research Center, where it became a key site for genetic improvement research on pure Jersey cattle (Hunde et al., 2015).
Data Source and Data Collection
Data for this study were gathered between 1986 and 2019 from individual animal records to facilitate subsequent trait analysis. Specific details such as the identification number of each cow, calving date, cow parity, animal group, Lactation Milk Yield (LMY), Daily Milk Yield (DMY), and Lactation Length (LL) were extracted from the farm's datasets.
Traits Studied
Traits included in this study milk production traits (lactation milk yield, daily milk yield and lactation length).
Estimation of Genetic Parameters
The covariance components and genetic parameters (including heritability, repeatability, genetic and phenotypic correlations, and breeding values) were estimated using the WOMBAT software (Meyer, 2012) with a fitted animal model. Univariate analysis was conducted for each trait to estimate heritability, repeatability, and breeding values, while bivariate analysis was employed for estimating genetic and phenotypic correlations. Fixed factors with significant effects were incorporated into the model for genetic parameter estimation. For traits such as Lactation Milk Yield (LMY), Daily Milk Yield (DMY), and Lactation Length (LL), a repeatability animal model was utilized, incorporating direct additive effects and permanent environmental effects as random effects due to multiple records per cow. Initial analysis identified fixed effects including animal group (imported and farm-born Jersey cows), year of calving, season of calving, and parity, of which only animal group, year, and parity significantly contributed to variations and were included in the genetic parameter analysis. Significance testing of fixed effects was performed using the GLM procedure of SAS, with additive genetic, permanent environmental, and residual effects treated as random effects. Parities exceeding 6 were consolidated into a single parity record due to limited data. Contemporary groups were not included as a fixed effect in the model due to the absence of uniform feeding and management practices across cows within the herd, across seasons, and over years. The detailed methodology involved a three-step analysis as described below.
Step 1: Preliminary analysis of fixed effects to determine level significance of milk production traits (LMY, DMY and LL):
Yijkl=μ+Yi +Sj+Gk+Pl+eijkl
Where,
Yijkl=LMY, DMY and LL of ijkl cow with ith year, jth season, kth genetic group and lth parity.
μ=Overall mean.
Yi=The fixed effect of ith year of calving (i=1986 to 2019).
Sj=The fixed effect of jth season of calving (dry, short rain and main rain season) (but not significant here).
Gk=The fixed effect of kth animal group (imported and farm born).
Pl=The fixed effect of 1th parity (l=1, 2, 3, 4, 5 and ≥ 6).
eijkl=Random error associated with each observation.
Step 2: Analysis of variance components and genetic parameters fitted with significant fixed effects.
Animal group, year and parity were all significant in the fixed effect analysis and were fitted in to analysis of genetic model. The representation of the animal model used to estimate genetic parameters for milk production traits are as follow:
Y=Xb+Zla+Z2c+e
Where,
Y is a vector of records/observations for the traits of interest.
b is a vector of fixed effects (fixed effects which had a significant effect such as animal group, year, and parity in this case).
a is a vector of random individual direct additive genetic effects.
c is a vector of permanent environmental effects.
X is a matrix relating records to fixed effects.
Z1 is an incidence matrix for direct additive genetic effects.
Z2 is an incidence matrix for permanent environmental effects.
e is a vector of random residual effects.
The model was assumed as expected value of Y to be Xb. The vector random individual additive genetic effects, permanent environmental effects and residual effects are assumed to be uncorrelated and have expected mean of zero and variances σ2a, σ2c and σ2e respectively. From these expectations, the (co)variance components, heritability, repeatability and Estimated Breeding Value (EBV) of each trait from multigenerational pedigree data were estimated using WOMBAT software.
Heritability was estimated as the ratio of the additive genetic variance to total phenotypic variance; and repeatability, as the ratio of the sum of the additive genetic variance and permanent environmental variance to total phenotypic variance.
Below are formulas used to calculate heritability, repeatability and, genetic and phenotypic correlations
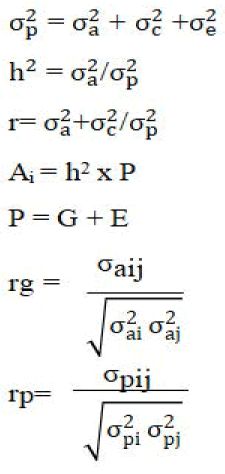
Where,
σp2: Phenotypic variance (total variance).
σa2: Additive genetic variance.
σc2: Permanent environmental variance.
σe^2: Residual variance.
h2: Heritability value.
r: Repeatability value.
Ai: Estimated breeding value.
P: Total phenotypic value.
G: Genotypic value.
E: Environmental value.
rg: Genetic correlations.
rp: Phenotypic correlations.
σaij: Additive genetic covariance between trait i and j.
σpij: Phenotypic covariance between trait i and j.
σai2: Additive genetic variance for trait i.
σaj2: Additive genetic variance for trait j.
σpi2: Phenotypic variance for trait i.
σpj2: Phenotypic variance for trait j.
Step 3: The genetic trends for milk production traits (LMY, DMY, and LL) were assessed by regressing the average breeding values of each trait against the year of birth. These trends were estimated using the solution of animal model equations, employing the BLUP method within the WOMBAT software, for the past 33 years (1986-2019). Animals with unknown pedigrees were assigned an estimated breeding value of zero as the baseline. The analysis of genetic trends in purebred Jersey cattle at the Adea-Berga dairy research farm offers valuable insights for reassessing management practices and optimizing selection programs to enhance milk performance in these dairy cows. The recent introduction of Jersey sire semen from around the globe has enhanced the genetic diversity of the herd and reduced inbreeding coefficients. Additionally, precautions were taken by artificial insemination technicians to ensure that there were no genetic relationships between the sire semen used and the existing herd. The number of records analyzed for milk production traits in pure Jersey cows, along with their averages and coefficients of variation, are summarized in Table 1.
| Items | LMY (Liters) | DMY (Liters) | LL (days) |
|---|---|---|---|
| Number of records | 2912 | 2912 | 2912 |
| Number of sire | 99 | 99 | 99 |
| Number of dam | 456 | 456 | 456 |
| NPR/sire | 29 | 29 | 29 |
| NPR/dam | 6 | 6 | 6 |
| Mean | 2171 | 6.57 | 335 |
| SD | 877.75 | 1.8 | 123.38 |
| LSM | 2166.1 | 6.37 | 344.89 |
| SE | 26.71 | 0.05 | 3.81 |
| Minimum | 200 | 0.3 | 100 |
| Maximum | 9527 | 41.79 | 976 |
| Range | 9327 | 41.49 | 876 |
| C.V. % | 38.52 | 23.81 | 35.62 |
| Note: LMY: Lactation Milk Yield; DMY: Daily Milk Yield; LL: Lactation Length; NPR: Mean Number of Progeny; SD: Standard Deviation; LSM: Least Square Mean; SE: Standard Error; CV: Coefficient of Variation. | |||
Table 1:Description of data structure for milk production traits.
Variance Component and Heritability Estimates for Milk Production Traits
Table 2 presents the variance components, heritability (h2), and repeatability (r) estimates for milk production traits. In this study, lower heritability estimates were observed for both Lactation Milk Yield (LMY) (0.14 ± 0.00) and Lactation Length (LL) (0.04 ± 0.02), suggesting significant influence from environmental factors on trait expression. As depicted in Table 2, substantial disparities were noted between additive genetic variances and either permanent environmental or unknown environmental variances, indicating that the genetic potential of Jersey cows is constrained by higher levels of permanent environmental and unknown variances. Dechow et al., and Wasike (2006) noted that environmental factors such as climate, feed quality, and disease prevalence exert greater influence on animal performance in subtropical and tropical regions compared to temperate regions. Consequently, heritability tends to be lower in tropical regions, potentially explaining the lower estimates observed in our study.
Lactation Milk Yield (LMY)
The direct heritability estimate for Lactation Milk Yield (LMY) in purebred Jersey cattle from the univariate analysis conducted in this study was found to be 0.14 ± 0.00 (Table 2). This figure contrasts with the findings of Aynalem et al., for Ethiopian Boran × HF crossbreeds (0.20 ± 0.03), Tadesse for Ethiopian Boran × HF crosses (0.57 ± 0.02), and Gebregziabhere et al., for Ethiopian Boran × HF crosses (0.26 ± 0.08). The relatively harsh environmental conditions in the study area likely contribute to higher permanent environmental and error variances, resulting in elevated phenotypic variance, potentially diminishing the heritability of lactation milk yield.
Daily Milk Yield (DMY)
In the current study, the direct heritability estimate for Daily Milk Yield (DMY) in purebred Jersey cattle, obtained through univariate analysis, was determined to be 0.12 ± 0.04 (Table 2). This finding aligns closely with the findings of Aynalem et al., for Ethiopian Boran × HF crossbreeds (0.13 ± 0.03). However, our estimate of heritability falls below that reported by Gebregziabhere et al., for Jersey × Boran crosses (0.34 ± 0.13) and Tadesse for Ethiopian Boran × HF crosses (0.52 ± 0.02).
Lactation Length (LL)
The heritability estimate for lactation length in purebred Jersey cattle, derived from univariate analysis in this study, was determined to be 0.04 ± 0.02, consistent with the findings of Yosef, who reported a value of 0.02 ± 0.01 for Jersey breeds. Higher heritability values were observed by Aynalem et al., for Ethiopian Boran × HF crossbreeds (0.26 ± 0.03) and Tadesse for Ethiopian Boran × HF crosses (0.27 ± 0.03). Enhancing genetic selection for one or a combination of these milk production traits within the population, alongside improvements in herd management and feeding practices, could potentially elevate additive genetic variance and ameliorate the lower heritability values of milk production traits. This study underscores that the lower heritability estimates for milk production traits are likely a consequence of adverse environmental conditions.
| Parameters | Milk production traits | ||
|---|---|---|---|
| LMY | DMY | LL | |
| σ2a | 94169.9 | 0.29 | 603.3 |
| σ2c | 127148 | 0.7 | 821.82 |
| σ2e | 454404 | 1.49 | 12286.1 |
| σ2p | 675721.9 | 2.47 | 13711.22 |
| h2a ± SE | 0.14 ± 0.00 | 0.12 ± 0.04 | 0.04 ± 0.02 |
| C2 ± SE | 0.19 ± 0.00 | 0.28 ± 0.04 | 0.06 ± 0.03 |
| e2 ± SE | 0.67 ± 0.00 | 0.60 ± 0.02 | 0.90 ± 0.02 |
| R ± SE | 0.33 ± 0.00 | 0.40 ± 0.02 | 0.10 ± 0.02 |
| Note: σ2a: Additive genetic variance; σ2c: Permanent environmental variance; σ2e: Residual variance; σ2p: Phenotypic variance; h2a: Heritability of direct genetic effects; c2: Permanent environmental variance as a proportion of phenotypic variance; e2: Residual variance as a proportion of phenotypic variance, r: repeatability, SE: Standard Error; LMY: Lactation Milk Yield; DMY: Daily Milk Yield; LL: Lactation Length | |||
Table 2: Estimates of variance components and genetic parameters for milk production traits.
Repeatability of Milk Production Traits
In the current study, repeatability estimates for lactation milk yield, daily milk yield, and lactation length traits in purebred Jersey cattle were determined to be 0.33, 0.40 ± 0.02, and 0.10 ± 0.02, respectively (Table 2). This suggests that records for lactation milk yield, daily milk yield, and lactation length in purebred Jersey cattle could exhibit repeatability of approximately 33%, 40%, and 10%, respectively. Specifically, lactation milk yield and daily milk yield demonstrated moderate repeatability, while lactation length exhibited lower repeatability. The repeatability estimate for lactation milk yield in this study surpassed that reported by Aynalem et al., for Ethiopian Boran × HF crosses (0.17). Demeke et al., reported higher repeatability values for milk production traits, with lactation milk yield in HF × Boran and Jersey × Boran crosses at 0.39 ± 0.02, while Yosef reported a repeatability of 0.48 ± 0.08 for lactation milk yield in Holstein Friesian cows, and Aynalem et al., reported repeatability values of 0.54 and 0.7 for daily milk yield and lactation length, respectively, in Ethiopian Boran × HF crosses.
The repeatability estimate for daily milk yield in this study exceeded that reported by Demeke et al., for HF × Boran and Jersey × Boran crosses (0.30 ± 0.02). Similarly, the repeatability estimate for lactation length in purebred Jersey cattle in this study (0.10 ± 0.02) was higher than that reported by Yosef for Jersey breeds (0.04 ± 0.04).
Furthermore, at the Adea-Berga dairy research farm, the repeatability estimate for daily milk yield was higher than that for lactation milk yield and lactation length, suggesting that selection and culling based on daily milk yield performance could be conducted with reasonable accuracy. The lower repeatability estimates obtained for lactation length in this study indicate that this trait was significantly influenced by temporary environmental effects.
Genetic and Phenotypic Correlations
Direct genetic and phenotypic correlations for milk production traits were computed using a bivariate animal model, which considered two traits simultaneously. The estimates of direct genetic and phenotypic correlations among Lactation Milk Yield (LMY), Daily Milk Yield (DMY), and Lactation Length (LL) are presented in Table 3. In this study, the direct genetic correlations between milk production traits were generally higher than the corresponding phenotypic correlations. Direct genetic correlations specifically assess how both traits are influenced by a shared set of genes within an animal, whereas phenotypic correlations encompass the influence of both common genetic and environmental factors affecting two traits (Zeleke, 2019). With the exception of the DMY-LL correlation, phenotypic correlations between milk production traits in this study tended to be positive.
Genetic Correlations
Direct genetic and phenotypic correlations for milk production traits were computed using a bivariate animal model, which considered two traits simultaneously. The estimates of direct genetic and phenotypic correlations among Lactation Milk Yield (LMY), Daily Milk Yield (DMY), and Lactation Length (LL) are presented in Table 3. In this study, the direct genetic correlations between milk production traits were generally higher than the corresponding phenotypic correlations. Direct genetic correlations specifically assess how both traits are influenced by a shared set of genes within an animal, whereas phenotypic correlations encompass the influence of both common genetic and environmental factors affecting two traits. With the exception of the DMY-LL correlation, phenotypic correlations between milk production traits in this study tended to be positive.
Phenotypic Correlations
The phenotypic correlations observed among milk production traits varied in this study, with a negative correlation (-0.03 ± 0.02) between DMY-LL, a moderate correlation (0.49 ± 0.01) between DMY-LMY, and a high correlation (0.82 ± 0.01) between LMY-LL. The phenotypic correlation between LMY-LL aligned with findings reported by Tadesse. Compared to our study, Tadesse noted higher phenotypic correlations between DMY-LL (0.38) and DMY-LMY (0.86) in Boran cattle. Discrepancies between our study and others in the literature may arise from differences in breeds, sample sizes, and analytical approaches.
This study suggests that both random environmental and genetic effects could influence the phenotypic correlations of milk production traits. Notably, the phenotypic correlations among milk production traits in this study were lower than the direct genetic correlations (Table 3).
| Parameters | LMY | DMY | LL |
|---|---|---|---|
| LMY | * | 0.98 ± 0.06 | 0.98 ± 0.07 |
| DMY | 0.49 ± 0.01 | * | 0.93 ± 0.22 |
| LL | 0.82 ± 0.01 | -0.03 ± 0.02 | * |
| Note: LMY: Lactation Milk Yield; DMY: Daily Milk Yield; LL: Lactation Length | |||
Table 3: Estimates of genetic correlations (above diagonal) and phenotypic correlations (below diagonal) among milk production traits for Jersey cows.
Estimated Breeding Value
The average estimated breeding values for lactation milk yield, daily milk yield, and lactation length were calculated as 26.89 liters, 0.07 liters, and 0.09 days, respectively (Table 4). Across different birth years, the average estimated breeding values for milk production traits showed inconsistency. The highest estimated average breeding value for lactation milk yield (242.24 liters) occurred in 1995, while the lowest (-164.22 liters) was recorded in 1999. Notably, the genetic trend for lactation milk yield exhibited an increasing pattern from 1986 to 1989 and from 2011 to 2013. The average estimated breeding value for daily milk yield ranged from -0.114 to 0.52 liters, and for lactation length, it ranged from -817.69 to 867.73 days. The wide range of average breeding values observed across birth years could be attributed to effective management practices that enhanced the true genetic potential of cows. Conversely, lower breeding values in certain years may be linked to environmental factors such as feed quality, disease prevalence, and husbandry practices, which can hinder the expression of cows' genetic potential. Additionally, the absence of rigorous selection criteria and the use of sires from a limited source could impact the overall genetic progress in milk production traits.
Inconsistent trends in estimated breeding values were noted across birth years for all milk production traits, suggesting inefficiencies in selection practices and a lack of culling of unproductive cows based on performance. Figures 1 and 2 illustrate the estimated breeding values of Jersey cows for milk production traits (LMY, DMY, and LL) over the years of birth.
| Traits | N | Average EBV | Minimum | Maximum | Units |
|---|---|---|---|---|---|
| LMY | 2912 | 26.89 | -517.95 | 991.14 | Litres |
| DMY | 2912 | 0.07 | -0.84 | 3.96 | Litres |
| LL | 2912 | 0.09 | -29.83 | 38.46 | Days |
| Note: N: Number of observation; EBV: Estimated Breeding Value; LMY: Lactation Milk Yield; DMY: Daily Milk Yield; LL: Lactation Length | |||||
Table 4:Summary of EBV for milk production traits.

Figure 1. Genetic trend of Lactation Milk Yield (LMY) and Daily Milk Yield (DMY) based on year of birth.

Figure 2. Genetic trend of Lactation Length (LL) based on year of birth.
The heritability values for all milk production traits are notably low, suggesting that enhancing milk production performance relies more on improving animal management than genetic selection. The strong and positive direct genetic correlations among milk traits in this study indicate that selecting for one trait may positively impact the improvement of other traits. However, traits exhibiting negative direct genetic correlations imply an inverse relationship, where an increase in one trait results in a decrease in the other. Therefore, genetic correlations between traits should be taken into account when making selections and designing breed improvement programs.
The fluctuating genetic trends (estimated breeding values) observed for milk production traits over the study years suggest that these fluctuations stem from variations in selection intensity, the use of different sires with unknown breeding values over time, and the impact of management practices or environmental factors on the expression of cows' genetic potential.
In summary, improving management practices (including feeding, disease control, and climate management), implementing effective selection strategies, and employing appropriate breeding techniques are essential for enhancing milk production traits in the pure Jersey dairy cow population at the Adea-Berga dairy research farm.
[Crossref] [Google Scholar] [PubMed]
[Crossref] [Google Scholar] [PubMed]
[Crossref] [Google Scholar] [PubMed]
[Crossref] [Google Scholar] [PubMed]
[Crossref] [Google Scholar] [PubMed]