
Received: 27-Sep-2023, Manuscript No. GJAEE-23-115052; Editor assigned: 29-Sep-2023, Pre QC No. GJAEE-23-115052 (PQ); Reviewed: 13-Oct-2023, QC No. GJAEE-23-115052; Revised: 17-Jan-2024, Manuscript No. GJAEE-23-115052 (R); Published: 24-Jan-2024, DOI: 15651/2408-5510.24.12.008
Maize is among the top five cereal crops in Ethiopia and increasing its efficiency of inputs in its production could be considered as an important base in bringing food security. Therefore, this study aimed at analyzing the economic efficiency of maize production in the West Hararghe Zone using cross-sectional data collected from 157 randomly selected sample households during 2018/19 production season. Cobb-Douglas production function, and Tobit model were used to achieve the specific objective of the study. The estimated mean Return to Scale (RTS) was 0.93%, which shows the decreasing returns to scale. The analysis of resource productivity revealed statistically significant positive elasticity of land, seed, urea fertilizer, and oxen power. The estimated results showed that the mean technical, allocative, and economic efficiencies were 92.37, 55.08, and 50.28% respectively. Results of the Tobit model revealed that TLU, land allocated for maize, frequency of extension contact, and frequency of training were found to have positive effects on EE and AE. The sex of the household was found to have a negative effect on both EE and AE efficiency of farmers in the study area. Land allocated for maize, off/non-farm income, and experience on maize production have a positive effect on TE of households. Distance farm to the home was found to have a negative and significant effect on TE. The government should facilitate farmer training center in which the experienced farmers are trained and let to diffuse their accumulated practices to the youngsters with less experience.
Allocative efficiency, Level of efficiency, Maize, Technical efficiency
Background of the Study
African economy is highly depend on agriculture. Majority of the African population is employed in the sector, and it is the highest contributor to total national income. However, Africa is still producing too few products and its productivity has been largely stagnant (AGRA, 2018). Agriculture is the main economic pillar of the Ethiopian economy and the overall economic growth of the country is highly dependent on the success of the agriculture sector. The sector contributes 35.8% to the country’s GDP and around 80% of the national export earnings was obtained from this sector. This indicates that, the performance of the entire economy of the country largely depends on the performance of agricultural growth. Although increasing population pressure and low levels of agricultural productivity have aggravated the food insecurity situation by widening the gap between the demand for and supply of food in the country. According to Teka, the gap between supply and demand can be decreased through the introduction of modern technologies or by improving the efficiency of crop production.
In Ethiopia, cereals are the principal staple crop and the first crops in terms of the area coverage and the volume of production obtained. Cereals are produced almost in all regions of Ethiopia in different quantities. All Ethiopian regions have grown cereal crops with different quantities. Out of the total grain crop area, 80.71% were under cereals. Teff, maize, sorghum, and wheat took up 23.85%, 16.79%, 14.96% and 13.38% of grain crop area, respectively. Concerning production, cereals contributed 87.48% of the grain production. Maize, teff, sorghum, and wheat made up 27.43%, 17.26%, 16.89%, and 15.17% of the grain production respectively.
In the west hararghe zone, the volume of maize is 919,62.6 tons and total area coverage under maize is 8139,807.63 hectares and productivity per hectare is 2.31 tons, which is the second in terms of production and total area coverage in the zone. But the productivity of maize per hectare in the zone is too low and the last when compared to other zones of the Oromia regional state and also lower than the regional productivity, which is 3.82 tons.
Agricultural productivity can be enhanced through improving efficiency in the use of resources available or improvement in technology at given level of input. Therefore, knowledge about the level of economic efficiency of smallholder maize producers in the production and the underlying socio-economic and institutional factors causing efficiency may help to assess the opportunities for increasing agricultural production. This fulfills the existing gap by contributing towards a better understanding of potential production capacity of this crop using extended efficiencies measurement procedures.
Maize is the most important cereal crop that has a great advantage in the study. Among the cereals grown in the study area, maize is the second crop next to sorghum in terms of volume of the production and area coverage for cultivation of it. But the productivity of maize per hectare in the zone is too low and the last when compared to other zone of Oromia regional state and also lower than the regional productivity, which is 38.18 tons per hectare. Therefore, due attention should be given to strengthen the production and productivity of it.
A number of studies have been conducted on maize efficiencies of smallholder farmers in Ethiopia. However, in the study area they were limited information economic efficiency. This study was therefore conducted to evaluate the level of allocative, technical and economic efficiencies on maize production in West Hararghe Zone.
Description of the Study Area
West Hararghe Zone is one of the 22 zones found in the Oromia regional state of Ethiopia. West Hararghe takes its name from the former province of Hararghe. West Hararghe is bordered on the south by the Shebelle River which separates it from Bale, on the south west by Arsi, on the northwest by the Afar Region, on the north by the Somali Region and on the east by East Hararghe. Towns in West Hararghe include Chiro, Bedessa, Gelemso, and Mieso. The highest point in this zone is Mount Arba Gugu (3574 meters).
Based on population projection, the total population of west Hararghe zone in 2017 is assumed to be 2,435,350, of which 1,243,462 are men and 1,191,888 are women; 259,563 of its population were urban dwellers.
Farming system and crop production: Agriculture is the mainstay of the West Hararghe Zone. The farming system is characterized by mixed crop-livestock farming. Farmers produce different crop enterprises in the rain-fed farming in order to secure their family food supply and also cover various household expenses. The major crops grown in the zone is commercial crops like khat and coffee and cereal crops such as maize and maize, and others are cultivating in the area broadly primarily depend on Meher season. From these crops khat, sorghum, and maize is the most dominant one due to its nature to resist the drought climate (Figure 1).

Figure 1: Map of the study area.
Research Design, Data Types, Sources and Methods of Data Collection
Research design and data types: The study was employed the cross-sectional design survey data in the sense that relevant data was collected at some point in time. The study were used both qualitative and quantitative data types to get the overall picture of maize producers in the study area.
Sources of data: This study was used both primary and secondary sources of data. A primary data source was smallholder farmers randomly selected from different rural kebeles. The source of secondary data was zonal and Woreda agricultural office. Furthermore, list of different and relevant published and unpublished reports, bulletins from central statistical agency will be used as a source of secondary data.
Methods of data collection: Primary data were collected using semi structured questionnaires from maize producers as well as interview from key informative and focus group discussion
Semi structure questionnaire is a form questionnaire which carried out by the help of enumerator to read and explain for the interviewer. Because most individuals in the study area are illiterate and cannot read or write, face to face interview methods was used to administer structured questionnaires.
Interview key informant was used for this study so as to have the additional information on maize production. The key informant was done by interviewing in-personal the people like leaders of each of the kebele, DAs and other informative people on maize.
A focus group discussion: Involves gathering people who have experiences together to discuss a specific topic of interest. Generally involves group interviewing in which a small group of 6 to 8 people. It was led by an interviewer in a loosely structured discussion of various topics of maize.
Target Population, Sampling technique and Sample Size
Target population: The target population of this study was smallholder farmer of maize producer in West Hararghe zone.
Sampling techniques and sample size: In this study a multi stage sampling procedure was used to select the rural kebeles and sample households. In the first stage, Out of the 15 total woreda in West Hararghe zone the potential maize producer Woreda were selected purposively. In the second stage, maize producing kebeles were selected randomly based on their proportional. In the third stage, sample respondents households was randomly taken from each selected kebeles based on probability proportional to size of their sample maize producer distribution. The sampling frame of the study was the list of maize producer households in the selected kebeles (Table 1).
The sample size determination was employed using the formula given by Yamane with 95% of confidence level.
n=N/(1+N(e2))
=291,283/(1+291,283(0.082))
=157
Where,
n=Sample size
N=Population size of the woreda
e=Level of precision considered
| Woreda | Kebele | Total maize producer | Sample households |
|---|---|---|---|
| Gemachis woreda | Kokoriftu | 996 | 21 |
| Eloda | 990 | 20 | |
| Sireeharoo xaxe | 892 | 18 | |
| Oda bultum woreda | Cooma | 685 | 14 |
| Badesa guddaa | 725 | 16 | |
| Obbii 17 | 821 | 17 | |
| Habro woreda | Bareeda | 755 | 16 |
| Malka bal’o | 867 | 18 | |
| Gudina | 822 | 17 | |
| Total | 9 | 7,554 | 157 |
Table 1: Sample respondents selection.
Methods of Data Analysis
To address the objectives of this study, both descriptive statistics and econometric models of the data analysis was employed. After coding and feeding the collected primary data into the computer, STATA version 14 was used for analysis.
Descriptive statistics: Descriptive statistics such as mean, minimum, maximum, percentages, frequencies and standard deviation was applied to describe demographic, socio-economic, farm characteristics, institutional characteristics and distribution of efficiency levels of producers in the study area. Input uses, costs and outputs of production among sampled households were also presented using descriptive statistics.
Econometric analysis: Econometric analysis such as the stochastic frontier approach was used to estimate the level of maize production efficiency and a Tobit model was used to identify factors that affect the efficiency level of the farmers. This study was analyzed by the stochastic frontier model than data evolvement analysis because the former is used when the study is in uncontrolled environment. In the context of developing world where random errors (measurement error, weather and natural disaster) are common, SFPF is a relatively better measure of efficiency (Coelli, 2005). Moreover, a Tobit model is more appropriate when the dependent variable is bounded between 0 and 1 (Greene, 2003).
Specification of the econometric models: The objective of the study was to estimate the technical, allocative, economic efficiencies and to identify the various determinants of technical, allocative and economic efficiencies of maize production in study area. To achieve these objectives, the stochastic frontier production model was adopted with Tobit model.
The stochastic frontier production function was autonomously developed by Aiger et al., and Meeusen and van den Broeck. It uses for a key features that the disturbance term is composed of two parts, symmetric and a one sided component. The symmetric component captures the random effect outside of the control of the decision maker including statistical noise (such as weather, topography, and measurement error), etc., which are uncontrolled and exogenous to the farmer contained in every empirical relationship, particularly those based on cross-sectional household survey data. The one sided component captures deviations from the frontier due to inefficiency. The technique is consistent with most of the agricultural production, as a result, at a given level of resources, economic efficiency obtained from stochastic frontiers are expected to reflect the true ability of the farmer.
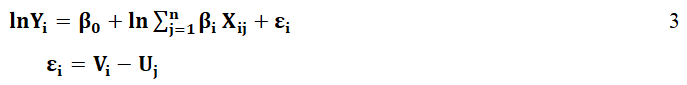
Following Aiger et al. and Meeusen and van den Broeck, the general functional form of stochastic frontier model is specified as follows:

Where, i=1, 2, 3…..n; In=natural logarithm; Yi= observed output level of the ith sample farmer; f(xi; β)=is convenient frontier production functions (e.g. Cobb-Douglas or translog); Xi=actual input vector by the ith farmer; β=vector of unknown parameters to be estimated; εi=a disturbance term made up of two error elements (vi and ui) and n=the number of farmers involved in the survey.
Stochastic frontier functional approach requires a priori specification of the production function to estimate the level of efficiency. Among the possible algebraic forms, Cobb-Douglas and translog functions have been the most popularly used models in the most empirical studies of agricultural production analysis.
Cobb-Douglas functional form has advantages over the other functional forms in that it provides a comparison between adequate fit of the data and computational feasibility. Cobb-Douglas has most attractive feature which is its simplicity (easy to estimate and interpret elasticity of production) Coelli and it requires estimation of few parameters hence it doesn't affected by degrees of freedom problem.
Moreover, Cobb-Douglas production function has been employed in many researches dealing with efficiency (Hasan, 2006; Jema, 2008). Therefore, it was also adopted for this study. The linear form of Cobb-Douglas production function for this defined as:
Where,
In=Natural logarithm;
j=Number of inputs used;
i=ith farm in the sample;
Yi=Observed maize output of the ith sample farmer;
Xij=Denotes jth farm input variables used in maize production of the ith farmer;
β=Stands for the vector of unknown parameters to be estimated;
εi=A composed disturbance term made up of two error elements (Vi and Uj).
Determinants of efficiency: In the study the relationship between demographic, socioeconomic, institutional and other factors that affect efficiency with the computed efficiencies index from stochastic production frontier will be estimated by Tobit model by taking efficiency index as a dependent variable and regressed on them. Tobit model is best suited for such analysis because of the nature of the dependent variable (efficiency scores), takes values between 0 and 1 Greene. Estimation with OLS regression of the efficiency score would lead to a biased parameter estimate since OLS regression assumes normal and homoscedastic distribution of the disturbance and the dependent variable Greene. Since there are no censored or truncated data the OLS and tobit model have been given the same output in this study.
The following relationship expresses the stochastic model underlying tobit Tobin.

Where,
yj*=Latent variable representing the efficiency scores of f arm j,
β=A vector of unknown parameters,
xjm=A vector of explanatory variables m (m = 1, 2… k) for farm j,
μi=An error term that independently and normally distributed with mean zero and variance σ2 and is independent of xjm.
Denoting yi as the observed variables:
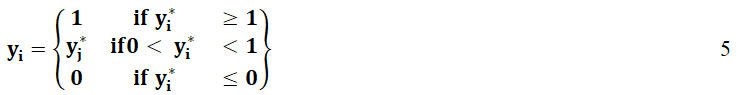
In the equation 5, the distribution of the dependent variable is not normally distributed rather its value varies between 0 and 1. Therefore, the maximum likelihood estimation which can yield the consistent estimates for unknown parameters vector is used rather than the Ordinary Least Square (OLS) estimation which gives biased estimates (Maddala, 1999) (Table 2).
| Variables | Description | Measurement | Expected sign | Type of variable |
|---|---|---|---|---|
| Dependents | ||||
| Efficiency scores | TE, AE and EE | % | ||
| Output | Output of maize | qt | ||
| Independents | ||||
| Input variable | ||||
| LAND | The land allotted for maize production | ha | + | Continuous |
| LABOR | Labor allotted for maize production | Man days | + | Continuous |
| OXEN | Oxen power used for maize cultivation | Oxen day | + | Continuous |
| SED | Amount of seed used for maize | kg | + | Continuous |
| Urea | Amount of urea fertilizer used for maize | kg | + | Continuous |
| DAP | Amount of DAP fertilizer used for maize | kg | + | Continuous |
| Agro-chemicals | Pesticide and herbicide used for maize | Lt | + | Continuous |
| Cost variable | ||||
| CLAND | Cost of land | ETB | - | Continuous |
| COX | Cost of oxen power | ETB | - | Continuous |
| CSED | Cost of seed | ETB | - | Continuous |
| CLAB | Cost of labour | ETB | - | Continuous |
| CUREA | Cost of urea fertilizer | ETB | Continuous | |
| CDAP | Cost of DAP fertilizer | ETB | Continuous | |
| CCHEM | Cost of agro-chemicals | ETB | Continuous | |
| Efficiency variables | ||||
| SEX | Sex of the household ( 1 if male, 0 female) | 1 or 0 | + | Dummy |
| AGE | Age of household | Years | + | Continuous |
| EDUC | Education level of household head | Years of schooling | + | Continuous |
| FMSZE | Total family size of household | AE | + | Continuous |
| TCULTLND | Total cultivated land of the household excluding area allocated for maize | ha | - | Continuous |
| FEXTCNT | Frequency of extension contact | Number | + | Continuous |
| DFHFLND | Distance from home to farm land | Hour | _ | Continuous |
| LIVSTKO | Number of livestock owned | TLU | + | Continuous |
| SFRTY | Fertility status of farm (1 fertile, 0 infertile) | 1 or 0 | + | Dummy |
| NFA | Non-farm activities | ETB | +/- | Continuous |
| CROP ROT | Crop rotations | 1 or 0 | _ | Dummy |
| PLOTDIST | Plot distance from home | km | - | Continuous |
| FRMXPRNS | Farm experience of the sample household | Year | + | Continuous |
| FRETRAINI | Frequency of training | Number | + | Continuous |
Table 2: Summary of description of variables and its value of measurement.
Descriptive Analysis
Demographic variables: Demographic, socio-economic, farm and institutional characteristics of the sampled farmers affect the quality of the management of the farmer directly or indirectly and effect on efficiency of production (Coelli and Battese 1996). These factors would help us to draw a general picture of the study area and sampled households. The demographic characteristics of sample households were examined with respect to age, sex, household size, religion, and education level of sample household heads.
Age of household head: In the study area the age of the sample households ranged from 22 to 65 years with an average of 38.34 years. The average household size of the sample households was 5.385 persons per household, with a standard deviation of 1.77.
Family size of the household head: Family size of the smallholder farmers is different from family to family in the study area. The average family size of the sample household heads was 5.38, with a minimum of 2 and maximum family size of 10. The result implies that the mean household size in the study area is relatively higher than the national average agricultural household size which is about 5.2 persons per household (Essa, 2011).
Maize farming experience of household: Farming experience is collected by the level of years the household head spent in maize farming, which may accumulate over time due to learning by doing. The more experienced the farmer is the more efficient he/she might be. From Table 3, the mean of maize farming experience of the study area was 10.77 years.
| Variables | No | Minimum | Maximum | Mean | Std. deviation |
| Age of house HHH | 157 | 22 | 65 | 38.34 | 6.59 |
| Family size of HH | 157 | 2 | 10 | 5.38 | 1.77 |
| Experience on maize production | 157 | 2 | 28 | 10.77 | 5.53 |
Table 3: Age of sample household heads and their family size.
Sex of the household head: Table 4 shows that, about 22.95% of the sample households were female headed and the remaining 77.05% were male headed. It was known that female headed households in rural areas in Ethiopia face more challenges in agricultural production and marketing compared with their male headed counterparts. This is partly due to cultural barriers and their busy schedules as they are engaged in domestic, reproductive and community roles. Besides, they may not accomplish the farming activities on time and efficiently.
| Variables | Category | Frequency | Percentage |
|---|---|---|---|
| Sex | Male | 94 | 77.05 |
| Female | 28 | 22.95 |
Table 4: Sex, marital status and religion of sample HHH.
Educational status of household head: Education is an instrument to improve the quality of labor through improving the managerial skill and the tendency to adopt new technologies. Education together with increased experience could guide farmers to better manage their farm activities which improve their productivity. Education also enhances the acquisition and utilization of information on improved technologies by households as well as their innovativeness. Concerning the literacy level of respondents, 39.34% of the household heads were illiterate while the remaining 60.66% had different levels of education, which ranged from grade one to the completion of secondary schools (Table 5).
| Category | Frequency | Percent |
|---|---|---|
| Illiterate | 48 | 39.34 |
| Basic education | 19 | 15.57 |
| Elementary | 45 | 26.88 |
| High school | 8 | 6.56 |
| Preparatory | 2 | 1.64 |
| Total | 122 | 100 |
Table 5: Education status of household heads.
Resource Basis Owned by Farmers
Under this part, land holding, livestock and off-farm activities which were the major resources in the rural area affecting smallholder farmer’s decision in maize production were discussed as follows.
Land holding: Land is the indispensable livelihood means or resource base for the rural community and plays typical role in farming. The size of land allocated for maize production has an influence on economic efficiency and the total amount of maize yield. An attempt was made to study the size of cultivated area on sample smallholder farmers in West Hararghe zone. Farmers use most of their land for crop production generally. The average own land holding of the sample households was about 0.92 ha within the minimum and maximum of .25 and 2.25 ha respectively. The average land left for grazing of the sample household were 0.2 ha. According to the focus group discussion respondents says, land allocated for maize is less than the land allocated for maize in another zone. The reason behind this is also the average landholding of the farmers in West Hararghe is less than other zones and more of land is allocated for khat production due to khat have more income-earning than maize. This holding size is even less by 25.8% than the national average landholding of 1.24 ha (Table 6).
| Amount land | N | Minimum | Maximum | Mean | Std. deviation |
|---|---|---|---|---|---|
| Total land of HH | 122 | 0.25 | 2.25 | 0.929 | 0.380 |
| Land left grazing | 122 | 0 | 0.2 | 0.049 | 0.217 |
Table 6: Land utilization and land holding of farmers.
Livestock ownership: Given a mixed farming system in the study area, livestock has an imperative contribution for the use hold income and food security. The type of livestock kept by sample farmers includes cow, oxen, bull, donkey, calf, goat, heifer and hen. Livestock have diverse functions for the livelihood of smallholder farmers in mixed farming system. They provide food in the form of meat, milk, and non-food items such as draught power and manure as inputs into crop production. In addition, they were source of cash income and act as a store of wealth and play a determinant role in social status within the community and buffering risk. Basically cattle, small ruminants and poultry are the major group of livestock at WHZ. To make the unit of measurement uniform conversion factor developed by Storck et al. was used to convert the herd size in to TLU. The result of survey shows that 86.9% of the total sample households have had less than five TLU. While 13.1% of them have had them has had greater than 5 TLU and the average TLU of the study area has 3.304 (Table 7).
|
Variable |
Observation |
Mean |
Std. dev. |
Min |
Max |
|---|---|---|---|---|---|
|
TLU |
122 |
3.304 |
1.374 |
0.72 |
6.8 |
Table 7: Average total livestock unit.
Non-farm activity: It is another way of generating income other than own farm activities. The effect on the production of farmer being involved in non-farm activities may be having two aspects. First, if farmer spends more time on nonfarm activities relative to farm activities, this may negatively affect agricultural activities. Second, income generated from nonfarm activities may be used to acquire and purchase inputs and hence positively complement farm activities.
Result in Table 8 indicates that 26.23% sample maize producer farmers engaged in off/non-farm income generated mostly petty trade and beekeeping and the remaining 73.77 % of household head were not engaged in non-farm income generating activities.
|
Variable |
Categories |
Frequency |
Percent |
|
Off/non-farm income participation
|
No |
90 |
73.77 |
|
Yes |
32 |
26.23 |
|
|
Petty trade |
21 |
65.63 |
|
|
Hand craft |
2 |
6.25 |
|
|
Type of off/non-farm participate
|
Brokers |
2 |
6.25 |
|
Beekeeping |
5 |
15.63 |
|
|
Government employee |
2 |
6.25 |
Table 8: Off/non-farm income participation of sample respondents.
Input Used in Maize Production
Land size allocated for maize: The average size of land allocated by sample farmers for maize crop in the study area was .488 ha, that ranges from .15 ha to 1.25 ha (Table 9).
|
Variables |
Frequency |
Min. |
Max. |
Mean |
Std. |
|
Total land allocated for maize |
122 |
0.15 |
1.25 |
0.488 |
0.244 |
Table 9: Land allocated for maize production.
Oxen: Agricultural production system in the study area was a traditional one, that is mainly relate with livestock especially ox. Farmers in the study area use oxen to perform different agronomic practices like ploughing, sowing and threshing. As indicated in Table 10 below there was variability of oxen ownership among farmers in the study area, ranging from one to 4. Usually, ploughing activity is done using a pair of ox; as a result 34.4% of the sample households cannot independently plough their farm using own oxen. Therefore, as an alternative, they used oxen exchange arrangements or rent-in from others. Generally, 65.6% of sample households in the study area have had a pair and above pair of oxen.
| Number of oxen | Frequency | Percentage |
|---|---|---|
| 1 | 42 | 34.4 |
| 2 | 67 | 59.4 |
| 3 | 10 | 8.2 |
| 4 | 3 | 2.5 |
Table 10: Number of oxen owned by maize producers.
Source of labour force for maize production: The result of the survey indicated that the majority of the sample households were used family labor. Among the sample household 90.16% used only their family labor.
The other left use own family labor and hired labour simultaneously and only hired labour 9.02 % and 0.82 respectively (Table 11).
| Type of labor | Frequency | Percent |
|---|---|---|
| Family labor | 110 | 90.16 |
| Own and hired | 11 | 9.02 |
| Only hired | 1 | .82 |
| Total | 122 | 100 |
Table 11: Type of labor used by maize production households.
Fertilizers and seed: Fertilizers and seed were major factors of agricultural production. The result of the survey indicated that the entire sample households were used inorganic fertilizer. From the total sample household, almost all of them were used DAP and urea simultaneously. Addition to inorganic fertilizer 31.93% of them were used organic fertilizer. Regarding to the type of the seed the used, the entire sample households were used almost local seed (Table 12).
| Fertilizer | N | % | |
|---|---|---|---|
|
Inorganic fertilizer |
DAP |
122 |
100 |
|
Urea |
122 |
100 |
|
|
Use organic fertilizer |
Manure |
38 |
31.93 |
Table 12: Type of fertilizer sample HH used for maize production.
Agrochemical used by farmers: Different external factor may damage agricultural production. pest and fungal disease is a common factor that damage maize production in study area. To overcome those problem farmers were used herbicide and fungicide to their maize farm. As the result of survey showed that almost all farmer doesn’t apply herbicide to their maize plot. Regarding to pesticide, 90.16% of sample household were applied pesticide to their maize plot (Table 13).
| Application of agrochemicals | Categories | Frequency | Percent |
|---|---|---|---|
| Herbicide | Yes | 1 | 0.82 |
| No | 121 | 99.18 | |
| Pesticide | Yes | 110 | 90.16 |
| No | 11 | 9.84 |
Table 13: Type of agrochemical used by sample household.
Maize Farm Characteristics
Soil condition: The result of the survey showed that 22.95% of respondents classified their maize farm as fertile class in fertility status and the remaining 75.1% of the respondents graded their land as medium fertile based on their perception.
Slope: Slope of land is a crucial factor in determining the rate of soil erosion which affects production and productivity. As a result of survey data indicated, based on the perception of the sample farmers, 85.25% of respondents perceive that the land they allocated for maize production was some slope and the remaining 14.75% believed that the allocated land for maize was flatter.
Crop rotation: Crop rotation reduces weed, crop disease and insects that causes losses of outputs and helps to increase fertility of the soil. The survey result show that from total sample households, 14.75% of them doesn’t practiced crop rotation and the left, 85.25% of them were adopted crop rotation practice (Table 14).
| Variable | Categorical | Frequency | Percent |
|
Soil condition
|
Fertile |
28 |
22.95 |
|
Medium |
92 |
75.41 |
|
|
Less fertile |
2 |
1.6 |
|
|
Plot slop
|
Steeper |
1 |
0.82 |
|
Medium |
103 |
84.43 |
|
|
Flatter |
18 |
14.75 |
|
|
Crop rotation |
Yes |
104 |
85.25 |
|
No |
18 |
14.75 |
Table 14: Maize farm characteristics of sample household head.
Maize farm proximity to homesteads: Distance is the time span required to reach the farm of sorghum production from homestead of the famer household and is essential variable in explaining the capacity of the farmers’ performance. And it refers to how long time it takes (in minutes) for a farm household to cover the distance from his/her residence to the sorghum plot. It is an important variable due to the fact that as the farmers’ farm located far from home, there would be limited access to manage agronomic practices. Out of the total sample households surveyed, about 63.06% responded as their maize farm was less than 1 km far from their residence, 28% were inside the radius of 1 kilometer to 3 km and the rest 9.84% sample household responded that they were far from their plot 3 km to 4.5 km (Table 15).
| Plot distance from home | Frequency | Percentage |
| <1 km | 78 | 63.06 |
| 1 km-3 km | 33 | 28 |
| >3 km | 11 | 9.84 |
| Total | 122 | 100 |
Table 15: Average distance from home to farm land.
Institutional Characteristics of Sample Households
Social and institutional support services like extension services, market accessibility, credit facilities, cooperatives, and availabilities of modern agricultural technologies and other rural infrastructures are necessary to facilitate agricultural production.
Extension service: Extension work in the region focuses on the provision of general advisory services on major agronomic practices (such as proper land preparation, application of fertilizer, timely and quality operation of weeding and harvesting), post-harvest handling, cooperative organization, soil and water conservation practices and irrigation development activities.
Extension service uses for speeding up the adoption of new technologies to the farmers as the increasing their agricultural productivity. The frequency of sample farmer contact with the extension service regarding to maize production is different from farmer to farmer. Some households were being contact with them frequently while others have got less chance or doesn’t gate chance to contact with them. Accordingly, 26.2% of sample households were being contacted with extension workers once a weak and 28.7% were contact with extension workers monthly during 2018/19 maize production season.
Credit: Access of credit increase capacity of farmer to purchase necessary inputs for agriculture production. Oromia Credit and Saving Share Company (OCSSCO) was major sources of credit in the study area. Out of total sample household only two respondents utilize credit service. Focus group discussion respondents state that “the access to credit is there in the zone. They give the credit service with interest rate but since most of the farmers are Muslims their religious are restricted from the usage of this interest rate credit service access. This is the reason why most of the maize producers are not use the access to credit service”. As indicated in demographic characteristic of sample household, about 88.52% of the sample household was Muslim. As a Muslim religion since interest is not recommended, much of them doesn’t took credit by cash or by kind also.
Training: Training increases awareness, dissemination of new information about productivity of inputs and management of their output for the farmer. About 12.7% of respondents had taken training at minimum one time and the other left couldn’t take training service. They provide training especially on land preparation, fertilizer application, sowing, weed, fungal and other disease management. Also they provide improved maize verity seed to the farmer at low cost. FGD participant also says that training much more important if arrange with practical ways. They also say the most organization that give training for us is benefit realize project and Machara research center (Table 16).
| Variables | Dummy | Frequency | Percentage |
|---|---|---|---|
| Extension service | Yes | 67 | 54.9 |
| No | 55 | 45.1 | |
| Credit service | Yes | 1 | 0.8 |
| No | 121 | 99.2 | |
| Training | Yes | 15 | 12.7 |
| No | 107 | 87.3 |
Table 16: Institutional service obtained by sample households.
Major Constraints and Opportunities of Maize Production
Constraints of maize production: The increasing demand for maize and its global advance implies that by 2023, maize will account for the greatest share (34%) of the total crop area harvested. This poses particular challenges to the global capacity to sustainably supply the volumes of maize needed particularly in low and middleincome countries. Maize farmers in Ethiopia face a series of challenges that limit their overall production and income. In order to identify the constraints and opportunities of maize production in the western Hararghe zone the researchers use the rank index (Table 17).
| Variables | 1st | 2nd | 3rd | 4th | 5th | 6th | 7th | 8th | 9th | Index | Rank |
| Weed problem | 0 | 0 | 1 | 3 | 19 | 13 | 11 | 34 | 41 | 0.056 | 9 |
| Soil fertility | 2 | 1 | 2 | 3 | 13 | 29 | 28 | 22 | 22 | 0.07 | 6 |
| Occ. disease | 13 | 20 | 44 | 32 | 12 | 1 | 0 | 0 | 0 | 0.146 | 4 |
| Resist. variety | 3 | 7 | 26 | 50 | 17 | 8 | 7 | 4 | 0 | 0.128 | 5 |
| Rainfall | 2 | 0 | 0 | 1 | 2 | 33 | 34 | 28 | 22 | 0.062 | 7 |
| Drought | 0 | 2 | 0 | 3 | 11 | 28 | 18 | 27 | 33 | 0.062 | 8 |
| Occu. insect | 55 | 35 | 19 | 6 | 2 | 5 | 0 | 0 | 0 | 0.176 | 1 |
| Increase price | 23 | 51 | 15 | 19 | 7 | 0 | 4 | 2 | 1 | 0.159 | 2 |
| Input supply | 21 | 23 | 39 | 6 | 15 | 15 | 3 | 0 | 0 | 0.147 | 3 |
Table 17: Major constraints of maize production in the study area.
Occurrence of insects and disease: The results of rank index show that occurrence of insects and disease is the major constraints of maize production in the study area. According to the FGD respondents maize production in the zone is also constrained by different insect pests and diseases. Pests like grasshopper, army worm, shoot fly, American worm and birds are common problems. Plant diseases such as rust long and head smut and leaf blights are some other important impediments for maize production in the study area.
Increase price of input for maize production: The major inputs used for maize production that purchased from the market by farmers are fertilizer, improved seed and agrochemicals. The rank index also shows that the increment in input price is the second constraints in the study area for maize production. Price of fertilizers and of improved seed was one of the major constraints that smallholder maize producers reported in the study area. According to the FGD fertilizers (DAP and urea) commonly used type of fertilizers and its price increased from time to time. They further explained that the land becoming more responsive for level of fertilizer they applied and thus they obligated to reduce land for maize. Regarding to the input price, another important constraint in the study area price of improved maize seed. FGD sample respondents reported that, the price of improved seed is very high as compared with the local seed (more than 2 times) which restrict the farmers to use improved maize seed to increase their productivity.
Input supply constraints: Since agricultural products are seasonal all useful inputs need early arrangement to boost the production by applying inputs on the right time. However the results of survey show that input supply is one of the constraints that hinder the maize production. The rank index for input supply is also shows it is the major constraints in maize production from the other constraints listed. The FGD respondents also say that, not only increase in price but also availability of the required type input by the producers was the major constraints in the production year. During the key informant also argues that, they had problems of the required type of improved seed, both type of fertilizer in sufficient ways and on time by the farmers.
Opportunities of maize production: The major opportunities for maize production in the study area are soil fertility, multipurpose use of maize and crops increased institutional support. According to the FGD reports there is shortage of land which minimizes the grazing land for livestock. In order to cover this problem the farmer use maize as feed and fodder of livestock and poultry.
Description of Production Function and Variable
Maize output was the dependent variable in the production function by quintal. It was estimated from six important inputs (fertilizer, seed, labor, oxen power, land and agrochemical). The average maize output for the sample households in the 2018/19 production season was 13.75 qt, that ranges from 5 to 32 qt with standard deviation of 5.48 qt. The land allocated for maize production by the sample farmers during the survey period ranged from .15 to 1.25 ha with an average of .544 ha. On averages the amount of seed that sample households used was 71.59 kg with range of 25 kg to 200 kg. The inorganic fertilizer that sample farmers used was ranged from 80 to 550 kg with an average 206.59 kg. Labor had a major role in agricultural production activities like plowing, sowing, weeding, application of agro-chemical, harvesting, and threshing. On average, 13.66 man-days were utilized for performing maize production activities by sample households with a minimum of 5 to a maximum of 35 mandays. Like other inputs, animal power was also important input, since the farming system in the study area was a traditional one. On average, sample households used 13 oxen days for maize production during the 2018/19 production year within a minimum of 4 and a maximum of 30 oxen-days. On average, the sample household used 0.595 ltr of chemicals for maize production with a minimum of 0.15 to a maximum of 2.5 ltr (Table 18).
| Variable | N | Minimum | Maximum | Mean | Std. deviation |
|---|---|---|---|---|---|
| Output (qt) | 122 | 4 | 32 | 13.75 | 4.88 |
| Seed (kg) | 122 | 25 | 200 | 71.59 | 34.94 |
| Land (ha) | 122 | 0.15 | 1.25 | 0.544 | 0.263 |
| Fertilizer (kg) | 122 | 80 | 550 | 206.59 | 95.75 |
| Labor (MD) | 122 | 5 | 35 | 13.66 | 6.87 |
| Oxen Day (OD) | 122 | 4 | 30 | 13.12 | 6.13 |
| Chemical (Ltr) | 69 | 0.15 | 2.5 | 0.595 | 0.26 |
Table 18: Summary of variables for estimation of production function.
Similar to the production function, the mean and standard deviation of each variable used in the cost function along with their contribution to the total cost of cultivation are summarized and presented in Table 21. The average total cost of birr 10,510.74 was required to produce 13.75 qt of maize. Among the various factors of production, the cost of labour and cost of fertilizer share 35.26% and 25.92%, respectively. They share more than half of total cost. Following the cost of land; seed, oxen and chemical cost share 2.48%, 8.85%, 24.80% and 2.69% respectively out total cost.
| Variable | Unit | Mean | Min. | Max. | St. deviation | % share of cost |
|---|---|---|---|---|---|---|
| Total cost | Birr | 10,510.74 | 701.75 | 21150 | 4292.43 | 100 |
| Cost of seed | Birr | 930.67 | 325 | 2600 | 454.27 | 8.85 |
| Cost of oxen | Birr | 2606.56 | 400 | 6000 | 1225.33 | 24.799 |
| Cost of chemical | Birr | 282.5 | 71.25 | 1187.5 | 185.49 | 2.69 |
| Cost of fertilizer | Birr | 3705.97 | 1532.5 | 9875 | 1719.01 | 35.26 |
| Cost of labor | Birr | 2724.59 | 1000 | 7000 | 1373.98 | 25.92 |
| Cost of land | Birr | 260.45 | 75 | 625 | 131.69 | 2.48 |
Table 19: Summary statistics of variables to estimate the cost function.
Econometric Results
The stochastic production frontier was applied using the maximum likelihood estimation procedure. The dependent variable of the estimated model was maize output produced in 2018/19 production season and the input variables used in the analysis were area under maize (ha), animal draught power (oxen-days), labor (man-days in man-equivalent), quantity of seed (kg), fertilizers (kg) and chemical (Ltr). To include those farmers who did not apply chemicals in the estimation of the frontier a very small value that approaches zero was assigned for non-users of chemicals. Prior to model estimation, a test was made for multi-collinearity among the explanatory variables using the Variance Inflation Factor (VIF). In a production function analysis, the correlation between some of the explanatory variables is expected and collinearity among economic variables is an inherent and age-old problem leading to problems of multicollinearity. However, the values of VIF for all variables entered into the model were below 10, which indicate the absence of severe multicollinearity among the explanatory variables. Also for a variable that cause’s efficiency variation among farmer was calculated to test for the existence of multicollinearity problem. Test for multicollinearity using both methodologies also confirm that there is no serious linear relation among explanatory variables (Table 20).
| Variables | Coefficients | Std. err. | Elasticity |
|---|---|---|---|
|
DAP |
0.005475 |
0.053911 |
0.00547 |
|
Urea |
0.1328318** |
0.052958 |
0.132832 |
|
Chemical |
0.013364 |
0.027371 |
0.013364 |
|
Land |
0.5041844*** |
0.089314 |
0.504184 |
|
Seed |
0.0844203* |
0.04567 |
0.08442 |
|
Labour-day |
0.114189 |
0.075825 |
0.114189 |
|
Oxen-day |
0.0722892** |
0.03505 |
0.072289 |
|
Cons |
1.381494*** |
0.394997 |
|
|
Lambda |
1.108423*** |
0.024225 |
|
|
Returns to scale |
|
|
0.926748 |
Table 20: Estimates of the Cobb Douglas frontier production function.
Out of the total seven variables considered in the production function, four (land, seed, oxen-day and fertilizer) had positive and a significant effect in explaining the variation in maize production among farmers in study area. Land was found to have the highest elasticity, followed by, fertilizer (urea), seed, and oxen-day. The value of the production coefficient for land was 0.504 and significant at 1% level of significance. This implies a one percent increase in farm size in hectares increases the maize output by 50.4% while all other factors held constant. This suggests that land was the major limiting factor of production that constrained maize farmers from maximizing their output.
Another important input in terms of its effect on the maize yield is the seed. The value of the production coefficient for seed was 0.084 which was significant at 10% level. The positive sign indicates that the yield of maize can be increased by using the quantity of more seeds. This implies that 1% increase in the quantity of seed with other factors remaining constant would increase the production of maize by 8.44%.
The coefficient for use of the oxen-day variable is positive and statistically significant at 5 percent having an elasticity of 0.0722. This implies increasing the level of use of oxen by 1 percent would significantly increase maize production by about 7.22%.
The application of inorganic fertilizer had a significant and positive influence on maize production at 5 percent level of significance having an elasticity of 0.133. Therefore, increasing the level of fertilizer use by 1 percent would significantly increase maize production by about 13.3%. This depicts that farmers who apply higher rates of chemical fertilizer receive higher maize output.
According to Gbigbi, the returns to scale analysis can serve as a measure of total factor productivity. The scale coefficient was calculated to be .9267; indicating decreasing returns to scale (Table 20). This result is consistent with the result of Hassen et al. who estimated the returns to scale to be 0.61 in their study area. The ratio of the standard error of u (σu) to the standard error of, v (σv) known as lambda (λ) is 1.108. Based on λ, gamma (γ) which measures the effect of technical inefficiency in the variation of observed output can be derived (i.e. γ=λ2/(1+λ2)). The estimated value of γ is 0.551 which indicates that 55.10% of total variation in farm output is due to technical inefficacy. In order to check whether technical inefficiency effects are absent, we may use the important test. The important parameter of log-likelihood in the half-normal model is λ=σu/σv. If the value of λ is equal to 0 there are no technical inefficiency effects and all deviations from the frontier are due to noise (Aigner et al., 1977). The estimated value of λ=1.108 is significantly different from 0 and the null hypothesis that there are no inefficiency effects is rejected.
Inadequate farm-level price data coupled with little or no input price variation across farmers of Ethiopia precludes any econometric estimation of a cost or profit frontier function. Therefore, the use of the self-dual production function allows the cost frontier function to be derived and used to estimate economic efficiency in situations where producers face the same input prices was given as follows:

Where C is the minimum cost of production of the ith farmer Y* refers to the index of output adjusted for any statistical noise and scale effects and ω stands for input prices.
Efficiency scores and their distribution: As discussed in the previous introduction sections one of the specific objectives of this study was to estimate the level of TE, AE and EE of maize producer sample households to tackle the low production of maize output in the study area. The MLE results of the stochastic frontier production functions estimated for the individual farm level TE, AE and EE independently for sample smallholder farmers. The model output presented in Table 19 indicates that the mean values of TE, AE and EE of the sample households were about 92.37, 55.08 and 50.28% respectively.
The mean TE of sample farmers was about 0.9237 with a minimum level of 0.74 and the maximum level of 0.999. This means that if the average farmer in the sample was to achieve the technical efficient level of its most efficient counterpart, then the average farmer could realize 7.63% derived from (1-0.9237/.0999/) × 100 increase maize output by improving TE with existing inputs and technology, using the resource at their disposal in an efficient manner without introducing and other improved or external inputs and practice.
In addition, the average AE of the sample farmers was about 0.55 with a minimum of 0.217 and a maximum of 0.999. This shows that farmers are not allocative efficient in producing maize and hence, a farmer with average level of AE would enjoy a cost saving of about 44.9% derived from (1-0.55/0.999) × 100 to attain the level of the most efficient farmer. Similarly, the mean EE of the sample farmers was 0.5028 implying that there was a significant level of inefficiency in the production process. That is the producer with an average EE level could reduce current average cost of production by 49.23% to achieve the potential minimum cost level without reducing output levels. It can be inferred that if farmers in the study area were to achieve 100% EE, they would experience substantial production cost saving of 49.23%.
This low average level of EE was the total effect of both technical and allocative inefficiencies (Table 21).
| Type of efficiency | Obs | Mean | Std. dev. | Min | Max |
|---|---|---|---|---|---|
| EE | 122 | 0.502849 | 0.219097 | 0.207777 | 0.971052 |
| AE | 122 | 0.550898 | 0.253909 | 0.217875 | 0.999628 |
| TE | 122 | 0.923759 | 0.056764 | 0.740438 | 0.999839 |
Table 21: Summary of descriptive statistics of efficiency measures.
The level of TE, AE and EE at which sample households operate is presented in Table 22. Most of households had a higher technical efficiency level. About 74.6% of maize farmers in the study area were operating above the 90% efficiency level of 25% of them were operating in the range of 80%-90% of technical efficiency levels. On the other hand, none of the farmers was operating below 70% of technical efficiency level.
| Efficiency level | TE | AE | EE | |||
| N | percent | N | percent | N | percent | |
| 0-0.0999 | 0 | 0 | 0 | 0 | 0 | 0 |
| 0.1-0.1999 | 0 | 0 | 0 | 0 | 0 | 0 |
| 0.2-0.2999 | 0 | 0 | 18 | 14.8 | 21 | 17.2 |
| 0.3-0.3999 | 0 | 0 | 30 | 24.5 | 38 | 31.2 |
| 0.4-0.999 | 0 | 0 | 19 | 15.6 | 15 | 12.4 |
| 0.5-0.5999 | 0 | 0 | 16 | 13.1 | 9 | 7.3 |
| 0.6-0.6999 | 0 | 0 | 3 | 2.5 | 5 | 4.1 |
| 0.7-0.7999 | 6 | 4.9 | 5 | 4.1 | 17 | 14 |
| 0.8-0.8999 | 25 | 20.5 | 6 | 4.9 | 12 | 9.8 |
| 0.9-0.9999 | 91 | 74.6 | 25 | 20.5 | 5 | 41 |
Table 22: Frequency distribution of efficiency estimates of sample farmers.
Determinants of efficiency differentials among farmers: After measuring levels of farmer’s efficiency and determining the presence of efficiency differences among farmers, finding out factors causing efficiency disparity among farmers was the next most important step of this study. To see this, efficiency levels of sample farmers were regressed on factors that were expected to affect efficiency levels using a Tobit estimation procedure. The result of the model showed educational status of household, age of house hold, total land allocated for maize, frequency of extension contact and plot distance from home were important factors influencing economic efficiency of farmers in the study area. The model also revealed that out of 16 variables five of them were found to significantly influence allocative efficiency of maize producers. These variables were sex of house hold, soil fertility and crop rotation. Where frequency of extension contact, training attending, weeding and sex of household are variables that affect technical efficiency of households.
| Variables | TE | AE | EE | |||
|---|---|---|---|---|---|---|
| Coef. | SE | Coef. | SE | Coef. | SE | |
| Sex HH | 0.005 | 0.0114 | -0.0762* | 0.0399 | -0.07** | 0.0341 |
| Age HH | -0.0002 | 0.0008 | 0.003 | 0.0025 | 0.003 | 0.0022 |
| Educa status HH | -0.0025 | 0.0038 | 0.0398*** | 0.0134 | 0.0382*** | 0.0115 |
| Family size | 0.0005 | 0.0027 | 0.0032 | 0.0095 | 0.0052 | 0.0081 |
| TLU | 0.0014 | 0.0039 | 0.0328** | 0.0129 | 0.0226** | 0.011 |
| Distance from road | -0.0023 | 0.0019 | -0.0008 | 0.0069 | -0.0022 | 0.0059 |
| Frequency extension contact | -0.0109 | 0.0099 | 0.1285*** | 0.034 | 0.1021*** | 0.0291 |
| Maize production experience | 0.0033*** | 0.0011 | 0.0023 | 0.004 | 0.0042 | 0.0031 |
| Proximity of land | -0.011*** | 0.0031 | -0.004 | 0.011 | -0.011 | 0.0096 |
| Land allocated for maize production | 0.094*** | 0.024 | -0.447*** | 0.079 | -0.357 | 0.068 |
| Number of oxen | 0.00327 | 0.00625 | -0.01895 | 0.02185 | -0.0163 | 0.0187 |
| Frequency of training | -0.00101 | 0.0143 | .08767* | 0.050027 | .0791* | 0.0428 |
| Soil fertility status | 0.008 | 0.0107 | -0.0126 | 0.0374 | -0.0043 | 0.032 |
| Land slope | 0.0074 | 0.012 | 0.54 | 0.588 | 0.027 | 0.0369 |
| Off/non-farm income | 0.0194* | 0.01 | -0.01 | 0.035 | 0.0023 | 0.03 |
| Distance from nearest market | -0.0004 | 0.0031 | -0.0008 | 0.01 | -0.0021 | 0.0093 |
| Constant | 0.83 | 0.046 | 0.461 | 0.1682 | 0.373 | 0.144 |
| Note: *, **, *** are represented 10, 5, and 1 significance level. | ||||||
Table 23: A two limit Tobit regression results of determinants of TE, AE and EE.
Sex of household: This variable is found significant at 10% level of significance. The expected sign of this variable is negative and the result obtained is in line with the expectation which indicates that gender of the household head being male as compared to female household head can have negative impact on farm in inefficiency. Expressed differently, gender of the household head being male as compared to female household head can have positive impact on farming efficiency. This is due to fact that the agricultural activities in the study areas have been practiced mainly by male and it was even considered as a males’ work and, hence, males allocate the majority of their times for outdoor activities in which agriculture is the paramount one.
Therefore, this causes the yield per hectare of maleheaded household to outweigh the female headed household. This study is similar to the results of the study found.
Total land allocated for maize: Total farm area was found to have significant and negative impact on EE and AE at one percent significant level and, which is in line with the hypothesis made. This finding suggests that increased larger farm size diminishes the timeliness of input use and farmers may encounter more problems in applying farm inputs at the right time; hence an inefficient use of farm inputs. Perhaps, timely and appropriate agricultural operation on larger land size given the traditional technology may not be effective which leads to higher level of inefficiency. The result is in line with the argument of Mustefa et al., and it might be because of farmers with larger area of land may face difficulty in managing that farm. Because of this, it could decrease the efficiency of the farmer. Several other researchers have found a negative and statistically significant relationship between these two variables because large land holding farmers are more likely to employ modern agricultural practices and hence could be more efficient due to its advantage of the economic scale and scope associated with large farm size (Endrias et al., 2010). Therefore, larger farms are relatively less efficient in economically and allocative than small size farms.
Experience on maize production: It also had a positively effect on technical efficiency and was statistically significant at 1%. Maize producers with many years of experience were more technically efficient than those with few years. The result shows that as the farmers maize production increase by one year the probability to be technically efficient is increase by 0.3%. The result is in line with the findings of Luke and Shamsudeen et al., which argues that increase in farming experience provides better knowledge about the production environment in which decisions are made.
Educational status of the household: It is used as a proxy for human capital; it potentially enhances farm efficiency and knowledge with regard to agricultural production. The result of survey also shows that, education level of a household head was highly significant affecting positively economic efficiency and allocative efficiency of smallholder maize producers at one percent significant level. The reason is that educated farmers were able to adopt different maize production technology and newer forms of farming methods than those farmers that not educated. Similarly Daniel found that the higher the level of formal schooling, the higher economic efficiency becomes. Hika and Oliyad also argues that Because of their better skills, access to information and good farm planning; more educated farmers are better to manage their farm resources and agricultural activities and minimize cost of production than less educated one. Nigusu and Milkesa explains that the more educated the farmer, the more technically, allocatively and economically efficient she/he becomes.
Frequency of training: Training farmers about farm management is important for farmers to improve their skills and practices. It was positively related with economic efficiency and allocative efficiency of farmers at five percent level. It was established that participating in farmers’ training program increased the possibility of efficiently using farm inputs. Training helped farmers to obtain information and to correct misconceptions concerning input usage. According to the focus group discussion the participant says that they have received training from Machara research center, benefit realizing project and woreda agricultural office are the main trainers organizations in the area. They train on row planting, pesticide applications and etc.
Livestock ownership: The amount of livestock owned, which is a proxy for estimating wealth status of a farmer, has a positive and significant effect on AE and EE in maize production at five percent level of significance. Farmers who owned a few number of livestock’s were allocativelly and economically more efficient than those who owned less number of livestock’s in the production of maize. This is because livestock provides a working power (oxen for draught power), manure fertilizer and is a source of income that can be used to purchase the necessary agricultural inputs. The result also disclosed that farmers having largest number of livestock holding help to avoid cash constraint. The results shows that other things remain constant, maize producer farmers who increased their number of livestock holding by one TLU could increase their economic efficiency and allocative efficiency by 3.28 and 2.26% respectively. The result of the study is in line with (Getachew et al., 2018).
Frequency of extension contact: Frequency of extension contacts with development agents is crucial to increase AE and EE of maize production in the study areas. Farm households who received regular extension visits by extension workers appear to be more allocative and economic efficient than their counterparts. The coefficient for the access to extension visit had statistically significant and positive relationship with AE at 5% level. The positive estimated coefficient for contact with extension workers imply that efficiency increases with the number of visits made to the farm household by extension workers. The results are in line with the findings of Tarekegn and Daniel who found that extension agents provide farmers with new information on improved production technologies, recommended agronomic practices, market and etc. Farmers who had more number of contacts with such agents improved their access to improved inputs and farming management practices thereby increased their production efficiencies.
Off/non-farm income: Off/non-farm activity was positive sign and statistically significant at 10% level of significance effect with respect to TE as expected. The reason is the income obtained from such activities could be used for the purchase of agricultural inputs (purchase seed, fertilizer, pesticides, and herbicides, and to pay for the hired labor) and supplement financing of household expenditures which they cannot provide from the farm income hence increases their efficiency. Therefore, higher farm income means higher purchasing power of the farmer to different farm inputs. Hence, higher farm income can reduce the farmers’ technical inefficiency in maize production. This study is similar to the results of Tolesa et al. who found a change in the dummy variable representing the participation in off/non-farm activities by the household ordered from 0 to 1 would increase the probability of the farmers being technically efficient. Mezgebo et al. argues also off/nonfarm activities might help farmers to generate additional income that might be used to purchase farm inputs.
Distance of maize plot from farm household: It is negative and significant at 1% levels of significance on TE. This relation may be because farmers living near the production site follow up whole day their maize plot that enables to better manage farms which leads to better achievement of their efficiency. The result confirms the expectation, because fragmented land leads to reduce efficiency by creating lack of family labour, wastage of time and other resources that would have been available at the same time. This result is in line with the empirical results of Assefa and Mustefa et al. and Tolesa et al. and Asfaw.
This study was conducted with the objectives of estimating the mean level of efficiencies and identifying the sources of technical, allocative and economic efficiencies variation among maize producers in west hararghe zone, Oromia National Regional State of Ethiopia. In order to achieve these objectives, both primary and secondary data were used. Primary data was collected from 122 sample smallholder maize growing farmer respondents of four kebeles from a cross sectional data of 2018/19 production season through interviews of farm household heads using structured questionnaire. Secondary data were collected from relevant sources to supplement the primary data.
Data analysis was carried out using descriptive statistics and econometric model for the estimation of efficiency level and factor of efficiency differentials among farmer. The Cobb-Douglas stochastic frontier production and its dual cost functions were used to estimate TE, AE and EE. Estimation of the production frontier indicated that among the total of seven variables considered in the production function, four (land, seed, oxen day and urea fertilizer) had a significant effect in explaining the variation in maize production among farmers in study area. This implying farmer should use the maximum possible levels of these inputs to enhance their maize production.
The findings showed that there was a wide gap between the highest and lowest technical, allocative and economic efficiency indices, with an average efficiency index of 92.37%, 55.28% and 50.08% respectively. Those efficiency indices showing that there is a room to increase production and productivity of households at the current available of resources utilization under available technology.
Regarding the sources of efficiencies variation, the study found that frequency of taking training, frequency extension contact and livestock unit were positively and significantly affect AE and EE. On the contrary; sex of the household heads and total land allocated for maize significantly and negatively affect EE and AE. Land allocated for maize, experience on maze production and off/nan-farm income activities are those significantly and positively affect TE and proximity to plot from home have significantly and negatively affect TE.
According to finding of this study, the averages levels of efficiency for maize producer in the study area were low and there were no farmer operating at fully technical, allocative and economic efficiencies levels. This indicates as there is ample opportunity for maize producer’s farmer to increase output at existing levels of inputs. Besides of this, farmers can produce the same amount of output by minimizing their current input using under available technology without compromising output. Therefore, an intervention aiming to improve efficiency of farmers in the study area has to give due attention for resource allocation in line with output maximization as there are big opportunities to increase output without additional investment.
The following recommendation remarks are drowning on the finding: