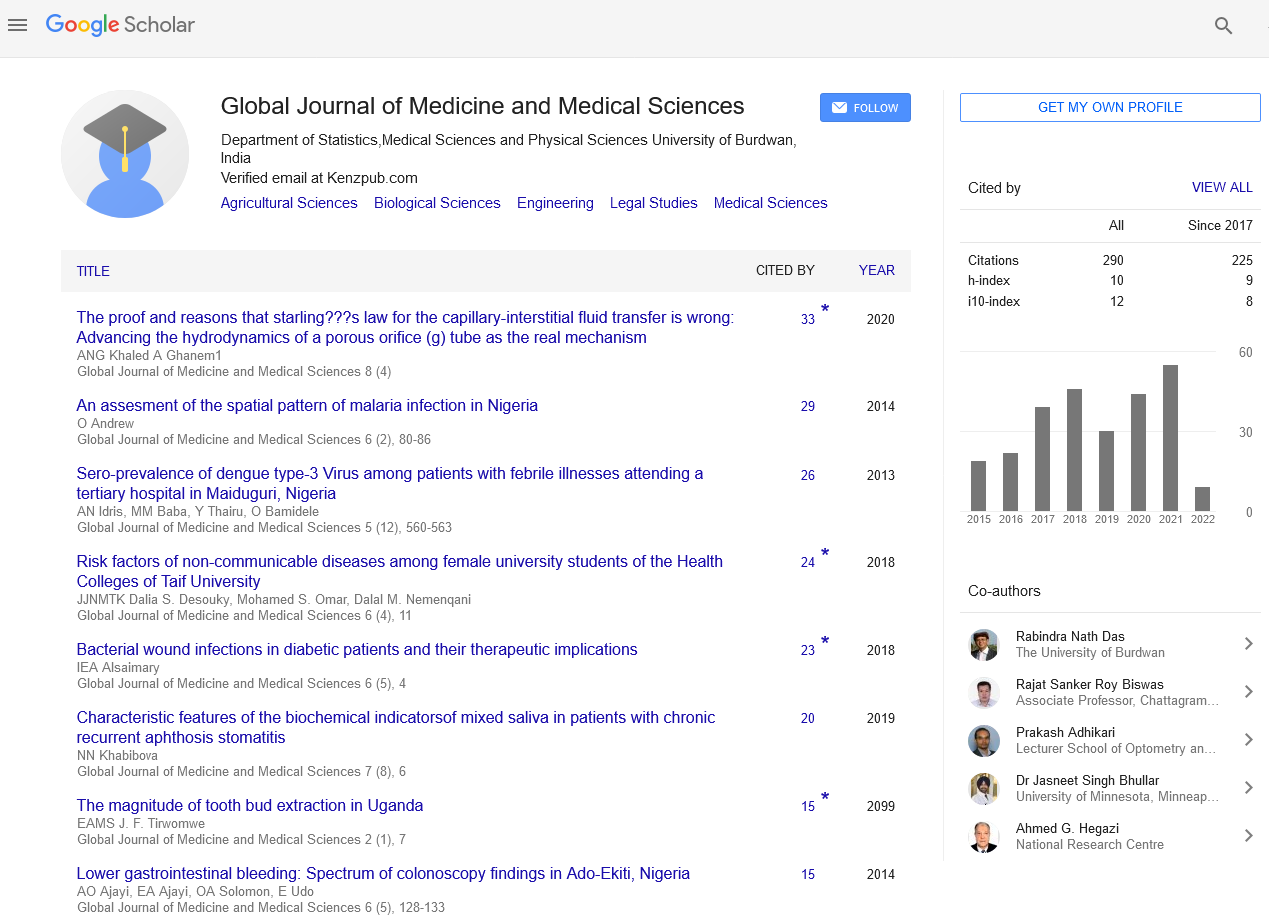
Global Journal of Medicine and Medical Sciences received 470 citations as per Google Scholar report
Gerald C Hsu
The author describes the quantitative relationship between his risk probability of having a cardiovascular disease (CVD), stroke,
or renal complications and his annual segmented data of both average daily glucose and daily metabolism index (MI) by using
GH-Method: math-physical medicine. In 2014, the author applied topology concept, finite-element engineering technique, and
nonlinear algebra operations to develop a mathematical metabolism model, which contains ten categories including four output
categories (weight, glucose, BP, other lab-tested data including lipids and ACR) and six input categories (food, water drinking, exercise,
sleep, stress, routine life patterns and safety measures). These 10 metabolic categories include approximately 500 detailed
elements. He further defined a new parameter referred to as the metabolism index (MI) that has a combined score of the above
metabolic categories and elements. Since 2012, he has collected and stored two million data from his own body health conditions
and personal lifestyle details. He then developed a set of algorithms which include a patient’s baseline data (e.g. age, race, gender,
family genetic history, medical history, bad habits) and conducted three calculations: (1) Medical conditions - individual M1
through M4: i.e. obesity, diabetes, hypertension, hyperlipidemia and others; (2) Lifestyle details - individual M5 through M10; (3)
MI scores - a combined score of M1 through M10. With this mathematical risk assessment model, he can obtain three separate risk
probability percentages to offer a range of the risk prediction of having CVD, stroke, or renal complications resulting from metabolic
disorders, unhealthy lifestyles, and their combined impact on the human body. This paper has demonstrated the strong effect of
metabolism (including glucose) on CVD/stroke risk probability % by using the annually segmented MI (and glucose) data. It has also
proven the solid influence of glucose on renal complications risk probability % using annually segmented glucose (and MI) data.
Share this article